
Thanks to the recent advancements made by Bitcoin, the crypto community believes that the bull run is not over yet, and BTC has the potential to break through $10K resistance easier than ever before. Indeed, there’s a grain of truth in the suggestion, but what are the real chances for value spike? Here are a few Bitcoin price predictions from TradingView experts proving that the glory times are coming soon.
It’s not all gold that glitters – BTC shines, too
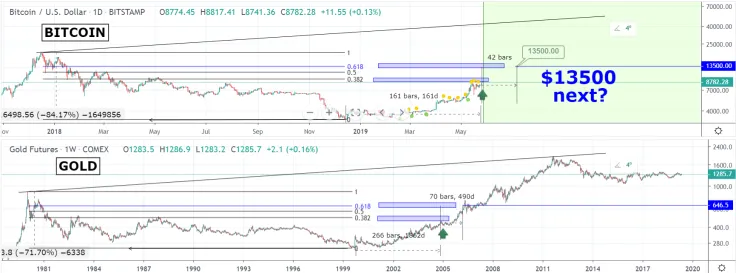
Who said that there’s no correlation between such assets as BTC and gold? TradingShot proves the opposite.
Proceed to the prediction page to check out all charts. You will see the history: $9,000 mark for BTC has been hit purely based on a signal given by the similarities of Bitcoin's price action after its bottom to Gold's respective pattern and the buy signal it gave after the +33.50% bounce. Bitcoin's price action smoothly followed the projected pattern. Next time, the Golden Cross signaled the rise from $5500 to $8500.
Today, we see that BTC is close to reaching its 0.382 Fibonacci retracement level from its All-Time High. When Gold approached the 0.382 level, it consolidated, and then skyrocketed to the 0.618 Fibonacci in 490 days. That's +0.26% on the 1862 days it took from the bottom to just below 0.382. If we apply the same rate on Bitcoin's 161 day's (bottom to just below 0.382), the projection puts $13,500 in 42 days!
Yet, the user notes that these conclusions shouldn’t define the final decision, because Bitcoin market is relatively young, so the traditional patterns apply to gold, dollars, and other fiat currencies aren’t always relevant for the crypto assets.

Bitcoin rocket is taking off
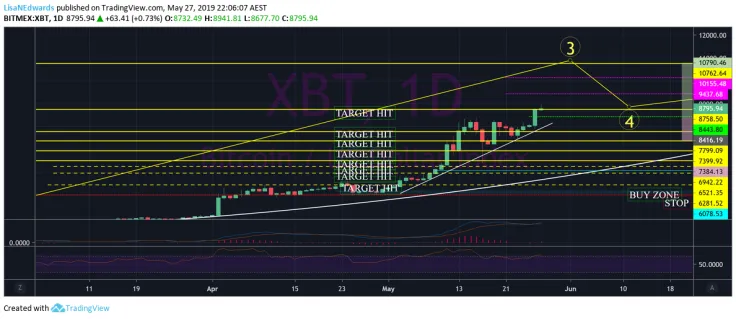
Several months ago, the user noticed a parabola on her charts since around $4,000 and said if we broke $6300 we would see $10,000. This is exactly what’s happening now.
We have 3 main targets right now- the 2 pink lines are subwave Targets and the Upper Yellow Line our greater wave target.
-
Target 1: 9444
-
Target 2: 10162
-
Target 3: 10750 (overall Target 11)
The volume right now is being moved by Futures Expiring and Crypto Funds starting to invest more into the market. If we keep an eye on the global market cap, we can see when ALTs or BTC are about to move. Over the last 2 days, BTC dominance has stabilized at 57.4% and had dropped as low at 55.7% in the preceding days which gave the ALTs the opportunity to bounce.
Since the start of May, we have seen the Global Market Cap grow $100 bln, which is massive. The volume has been fluctuating between $90 bln and $110 bln, and its natural growth will condition healthy growth of BTC.

BTC should touch daily MA200
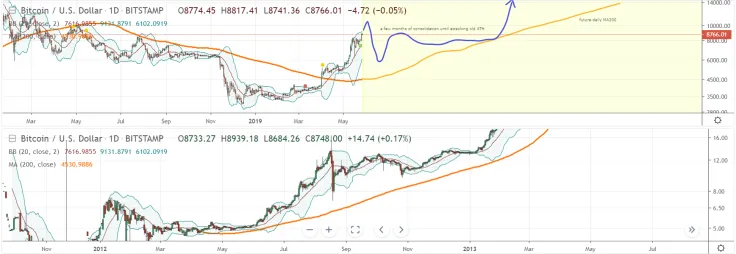
FlaviusTodorius67 appeals to the history of BTC price, too. Like in 2012 or in 2015/16, after this first rally of the new bull market, we'll need to retest the daily MA200.
There’s a possible future daily MA200 on the chart, taking the second 2012 rally, to which there are many similarities.
BTC will at least go to $10K first, it could of course also overshoot to $12K or somewhere around. However, we need a stronger correction to get down again from overbought levels on the weekly timeframe. The correction down to $5-6K will happen and is healthy.
Afterward, stabilization and consolidation in the $6-7K range for a few months, until the daily MA200 comes up so that BTC touches it, going sideways.
Then, the next leg up will happen. How low BTC can fall? FlaviusTodorius67 thinks it might be around $3,200 like this time. This is exactly the time when you shouldn’t miss your chances.
BTC price charts are taken from TradingView
 Dan Burgin
 U.Today Editorial Team