One more surprising weekend is behind, and BTC managed to make the impossible happen again. Not only has it reached $8,000 but it even managed to establish the new highest high for 2019. With its current value around $8,700, it has way more potential to reach the long-awaited level of $10K. What are the chances for success? Let’s find this out in these BTC price predictions from TradingView users.
Expect $10K in a couple of weeks

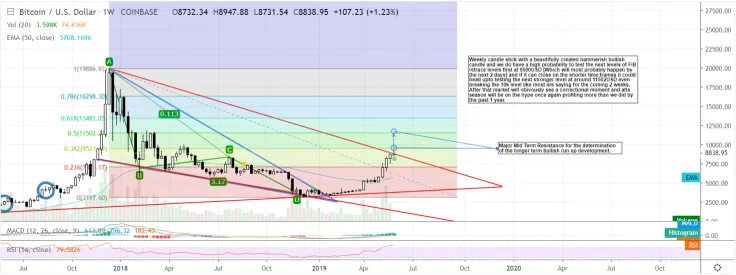
On the price chart from TogetherWeAccumulate, we can see the weekly candlestick with a hammer bullish candle and we do have a high probability to test the next levels of FIB retrace levels, first at $9,500 (which might happen in two days). If it can close on the shorter time frames, it could head up to testing the next stronger level at around $11,502, even breaking the $10k level like most are saying for the coming two weeks. After that, the market will obviously see a correctional moment and alts season will be on the hype once again profiting more than we did by the past 1 year.
Watch the Elliot waves

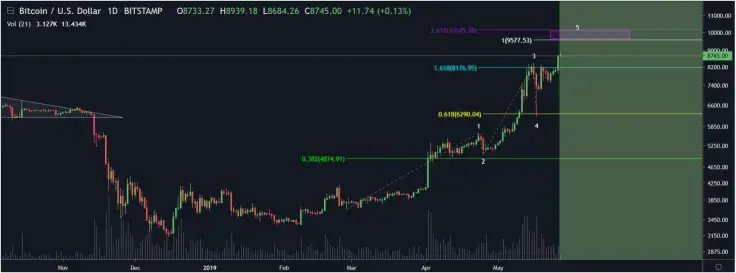
FateTrader analyzes the cycle of Elliot waves which started on the 27th of February as the beginning of wave 1 and the lows of 25th of April as the end of wave 2 just where the #2 is. If we draw a Fibonacci Extension between points 0, 1 and 2 we're getting the cyan 1.618 at $8176 and purple 2.618 at $10145. Notice how the wave 3 stopped exactly at the 1.618 extensions.
Now if we draw another extension between points 2, 3 and 4 we are getting the white 1 to 1 extension at $9577. If the wave 2 retraces only a little bit between 0.236 and 0.382 then the wave 4 retraces much more between 0.5 and 0.618 and this is exactly what happened, as you can see the green 0.382 Fibonacci Retracement which is drawn between points 0 and 1 is quite close to where the price retraced. This, in turn, has made the wave 4 to retrace much more and in fact, it did right to the Fib 0.618 drawn between points 2 and 3. Granted it was a flash crash but still worked out.
Now, both extensions create a potential target zone for the end of wave 5 which is marked as this pink box.
BTC will touch $11,600?

The user alanmasters is another trader with a positive attitude about Bitcoin’s future.
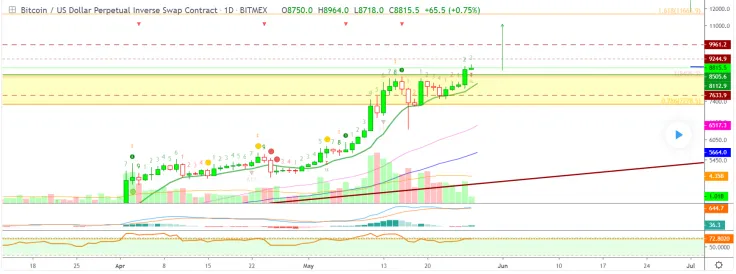
Looking at the daily chart above and past history, we believe Bitcoin can continue going higher, with the next resistance sitting at $9,240 short term and the immediate support being $8,500 followed by EMA10 ($8,110). Bitcoin is really strong and bullish right now.
The weekly candle that was supposed to be a "hanging man", ended up closing higher as a bullish hammer. Our charts for the weekly time frame were always bullish and this turned out to be true. We saw the monthly time frame recently, and we were really bullish on this chart, this is also playing out. We have high volume and this month’s candle looks like it can go straight to $9,900 and higher.
Bitcoin is now trading above strong resistance and with more growth to come. Fulfilling all of the positive expectations people are having, it even may reach the $11,660 target next!
Final thoughts
To sum it up, Bitcoin has disappointed bears – it appears to have the power to hit the $10K target. It’s only the matter of the time. Watch out – BTC has all chances to reach the $10K target by the beginning of summer. However, the $11K level still seems to be an exaggeration.
Bitcoin price charts are taken from TradingView

 Dan Burgin
 Alex Dovbnya
 Denys Serhiichuk
 Caroline Amosun