
Disclaimer: The opinions expressed by our writers are their own and do not represent the views of U.Today. The financial and market information provided on U.Today is intended for informational purposes only. U.Today is not liable for any financial losses incurred while trading cryptocurrencies. Conduct your own research by contacting financial experts before making any investment decisions. We believe that all content is accurate as of the date of publication, but certain offers mentioned may no longer be available.
Today's fall in the cryptocurrency market started with the sharp drop of Bitcoin (BTC). Almost all coins have followed its move except for Binance Coin (BNB), which is still located in the green, having risen by almost 4% since yesterday.
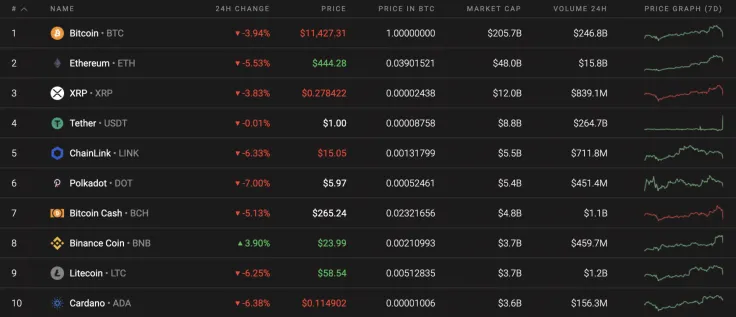
Most of the coins have lost much more than Bitcoin (BTC), which has positively affected the dominance rate of the leading crypto that has slightly increased and is now at 55.8%.
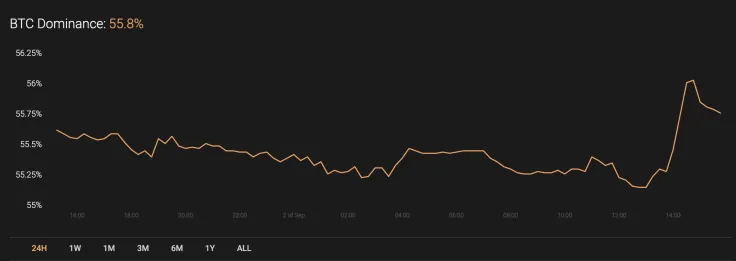
The key Bitcoin data today:
-
Name: Bitcoin
Advertisement -
Ticker: BTC
-
Market Cap: $210,426,963,007
-
Price: $11,388.14
Advertisement -
Volume (24h): $29,611,222,551
-
Change (24h): -4.93%
The data is relevant at press time.
BTC/USD: Is the today's drop a signal of the more profound correction?
After another failed attempt to fix above $12,000, Bitcoin (BTC) has declined by more than $500 within just a few hours. The drop has accounted for 3.83% over the last day.
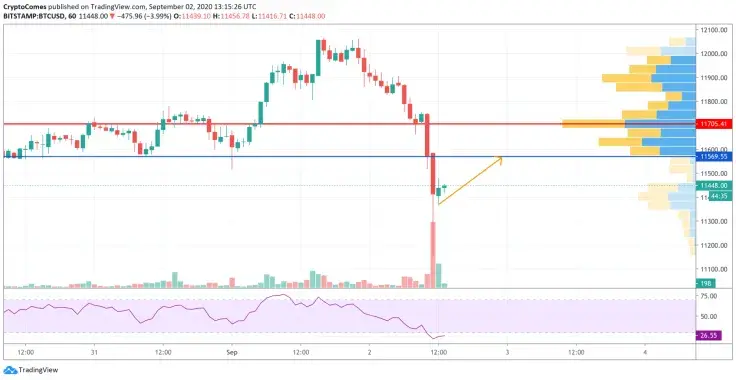
On the hourly chart, traders might expect a bounce off as Bitcoin (BTC) is already located in the oversold area according to the RSI indicator. Thus, there is almost no liquidity below, which means that sellers have run out of power in the short-term perspective.
To sum up, the correction after today's drop may lead BTC to the range of $11,550-$11,600 shortly.
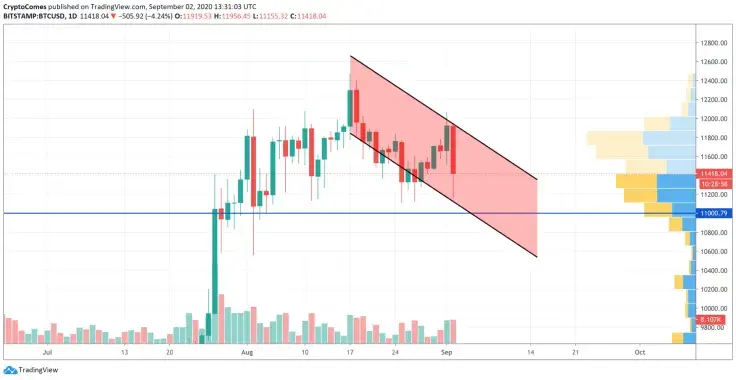
On the daily time frame, the current decline may be just the start of the more profound correction. Buyers have become more active as the selling trading volume has increased. If bulls do not return the rate of Bitcoin (BTC) to $11,500 shortly, there is a good chance that the leading crypto will begin trading around $11,000.
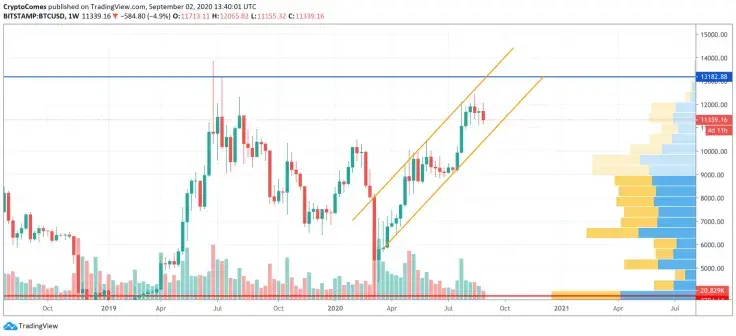
On the weekly chart, Bitcoin has been trading within the rising channel since the dump in March 2020. At the moment, the bullish scenario remains relevant until bulls get the coin to the nearest resistance at $13,000. It may happen by the end of the year if BTC remains in the ascending channel.
Bitcoin is trading at $11,329 at press time.
 Caroline Amosun
 Tomiwabold Olajide
 Dan Burgin