Disclaimer: The opinions expressed by our writers are their own and do not represent the views of U.Today. The financial and market information provided on U.Today is intended for informational purposes only. U.Today is not liable for any financial losses incurred while trading cryptocurrencies. Conduct your own research by contacting financial experts before making any investment decisions. We believe that all content is accurate as of the date of publication, but certain offers mentioned may no longer be available.
Bitcoin is presenting signals that suggest a need for caution despite its recent bullish behavior. Investors and technical analysts are closely monitoring the charts for indications of what may lie ahead for the world's premier digital currency.
As we dissect the BTC/USD pair on TradingView, we find Bitcoin hovering near the resistance level of approximately $69,000. This price point has served as a hard ceiling in recent times, with attempts to break through meeting stiff resistance. The relentless approach toward this barrier indicates strong bullish sentiment on the market, yet the inability to surpass it may lead to a buildup of selling pressure.
Support levels, crucial for maintaining the current rally, are established around $59,586, coinciding with the 50-day moving average. This moving average has historically acted as a reliable support in uptrends, but a break below could signal weakening momentum and the potential for a broader price correction.
Notably, the RSI is showing signs of divergence. While prices have continued to ascend, the RSI has begun to reach lower highs, suggesting that the underlying strength of the recent price increases may be waning. This divergence is often a precursor to a potential price reversal, and seasoned traders will be wary of this classic bearish signal.
XRP shows possibility
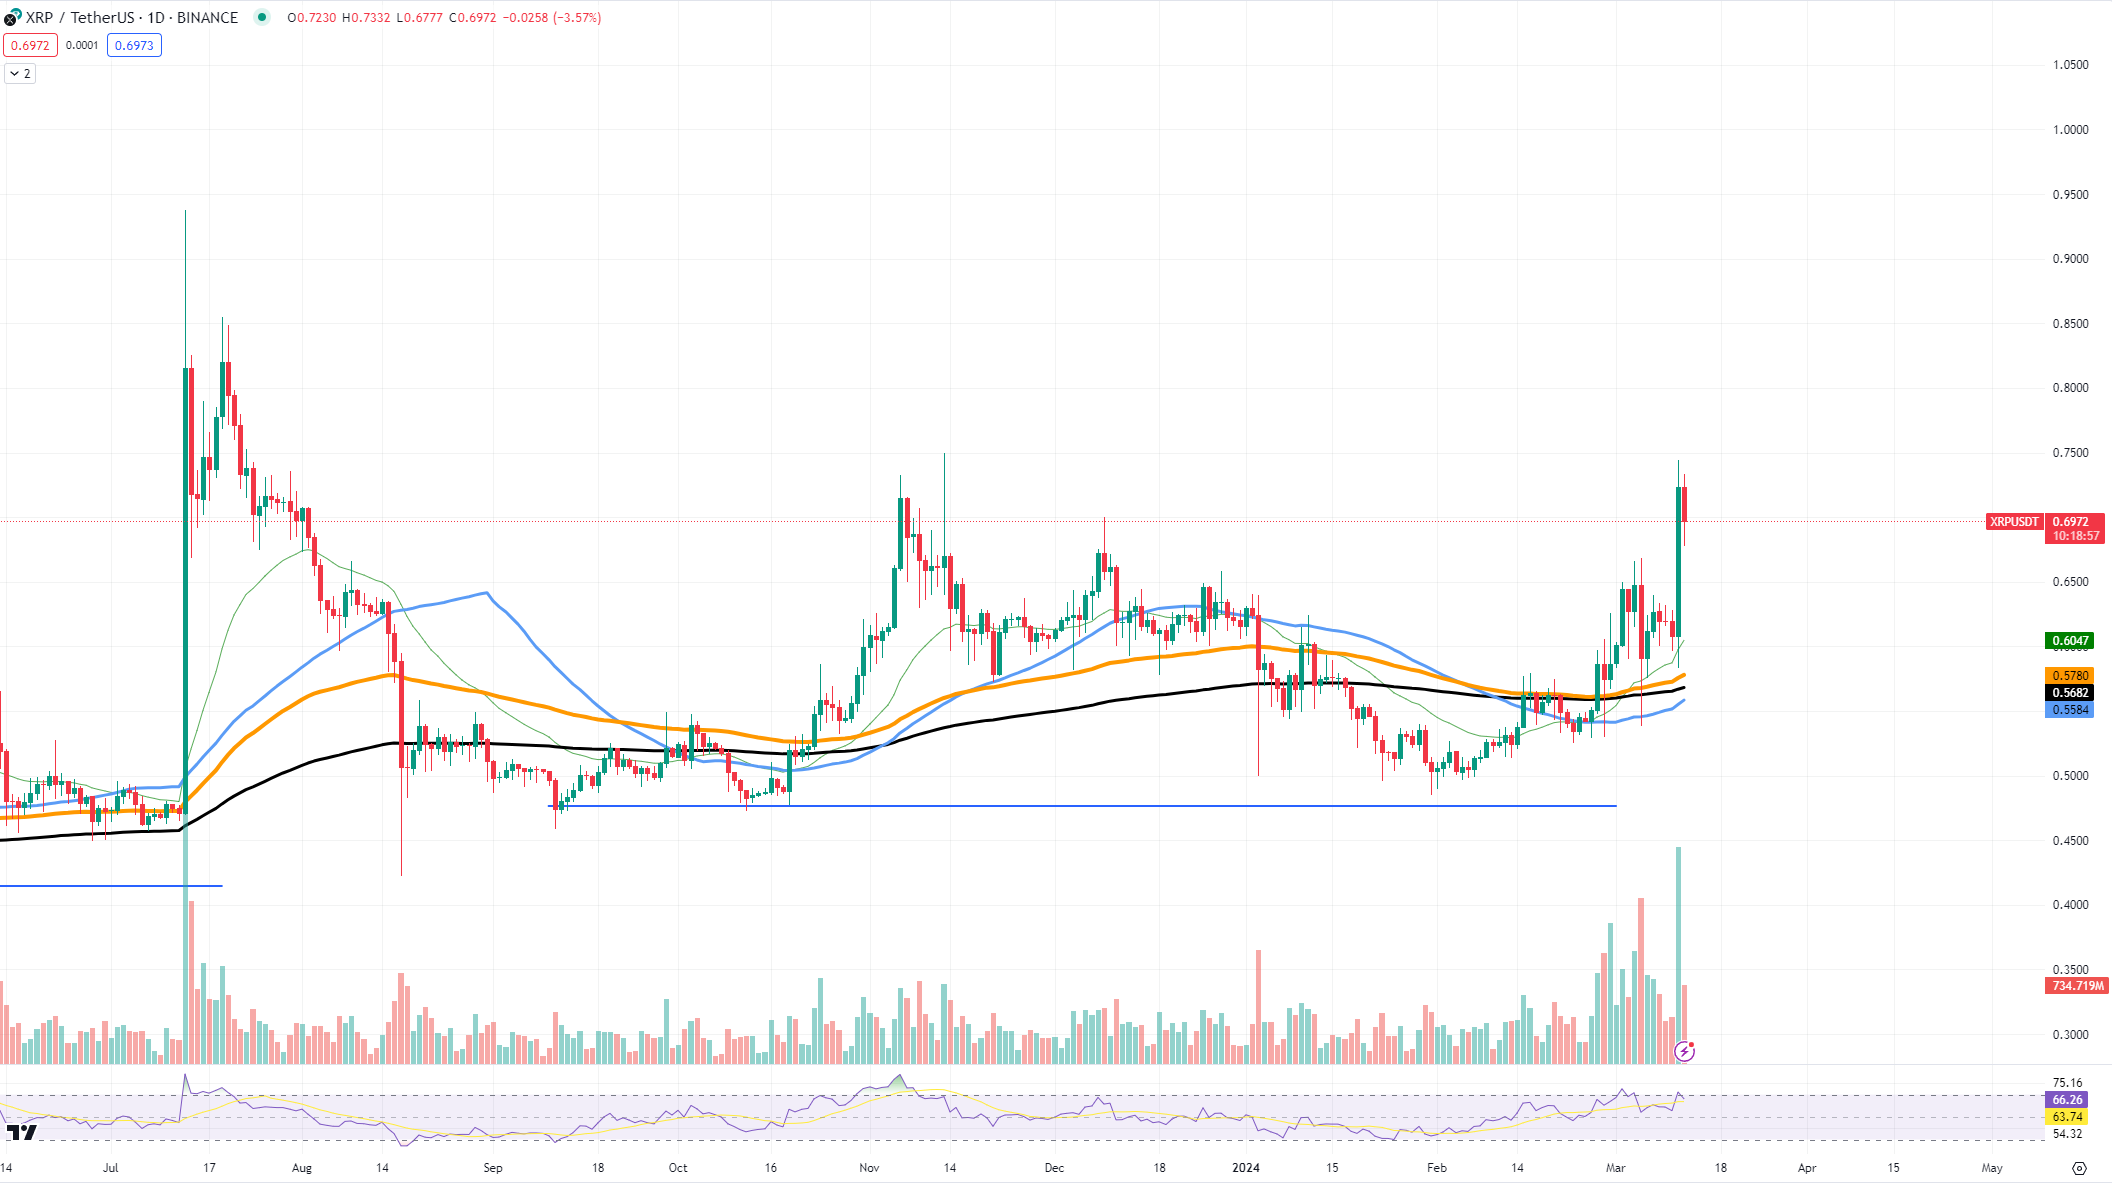
XRP is currently flirting with the possibility of a breakdown at the $0.73 resistance level. The asset's price movement on the charts is painting a picture that has traders and investors alike watching with bated breath to see if support levels will hold or give way to bearish pressure.
Upon analyzing the XRP/USDT pair on TradingView, we observe a challenging landscape. The $0.73 mark, which XRP recently approached with vigor, is proving to be a substantial barrier, one characterized by a cluster of sell orders that have historically capped upward movements. The resulting pushback is not a mere coincidence but a testament to the level's significance, often acting as a pivot point for XRP's price trajectory.
Local support levels are holding ground at around the $0.55 mark, where the 100-day moving average provides a cushion. This average is a key indicator for gauging long-term market sentiment, and a breach below this support could signal a bearish trend. Moreover, the $0.60 region has also been acting as a recent psychological support, fortifying the area between it and the 100-day moving average as a zone of considerable importance.
The looming resistance at $0.73 coupled with a massive selling wall suggests the potential for a breakdown. Should this resistance persist, we may witness XRP retracing its steps back to test lower support regions. Such a move would validate the concerns of a breakdown, potentially leading to a sell-off.
Solana in questionable state
Solana is not facing any problems, but at the same time, it is not really in a great state. While the technical price charts hint at bullish sentiment, underlying issues such as decreased inflows and trader hesitation present substantial challenges for the asset.
The SOL/USDT pair on TradingView has exhibited a commendable bullish trend, with the price recently hovering around the $150 mark. Local support levels have been identified near $120 and $111, corresponding with the 50-day and 100-day moving averages, respectively. These levels have historically served as robust safety nets during pullbacks, suggesting a strong buyer presence at these points.
On the resistance front, Solana faces its immediate hurdle near the $165 level. Overcoming this could pave the way for further upward momentum. However, the concern lies not in the chart but in the market dynamics.
Despite Solana's promising technology and strong community support, recent network outages have dented the confidence of investors and traders alike. The blockchain's reliability is under scrutiny, leading to a lack of conviction among traders to commit to Solana, as seen in the tapering inflows.
 Dan Burgin
 U.Today Editorial Team