
Disclaimer: The opinions expressed by our writers are their own and do not represent the views of U.Today. The financial and market information provided on U.Today is intended for informational purposes only. U.Today is not liable for any financial losses incurred while trading cryptocurrencies. Conduct your own research by contacting financial experts before making any investment decisions. We believe that all content is accurate as of the date of publication, but certain offers mentioned may no longer be available.
With the majority of technical indicators suggesting ongoing price pressure, Ethereum is currently dealing with serious challenges. ETH is currently struggling beneath a thick stack of moving averages despite brief indications of life earlier in April. This is concerning for bulls hoping for a quick recovery.
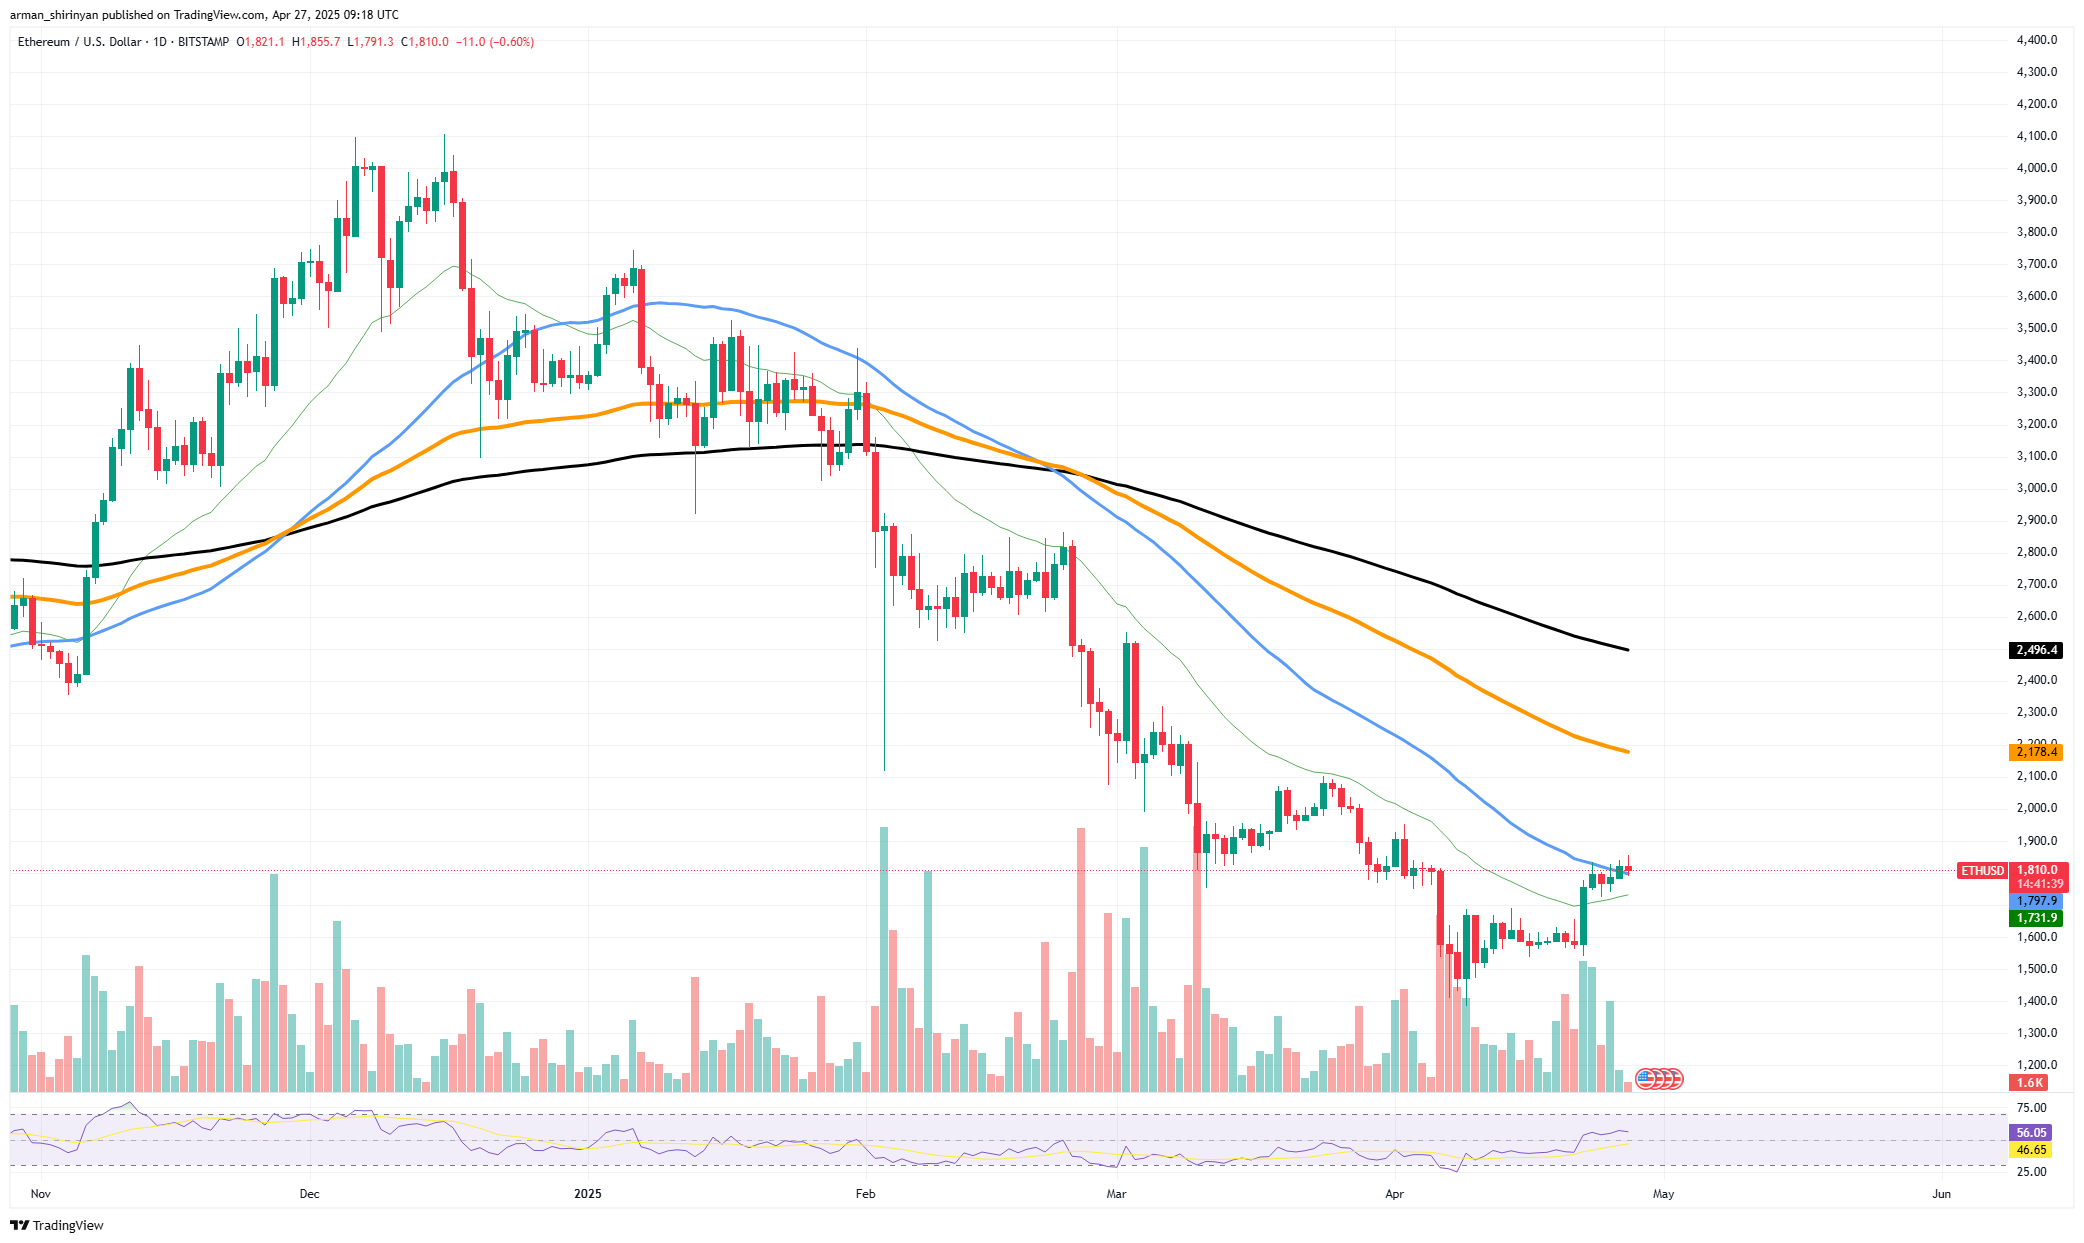
Ethereum has been unable to overcome significant resistance levels such as the 50-day and 100-day exponential moving averages (EMAs), according to the daily price chart. The price has consistently been rejected between $1,850 and $1,900, and every attempt to move higher has been met with selling pressure. Furthermore, the wider weekly moving averages paint an even more dire picture.
Ethereum is still trapped below important averages like the 8, 20 and 50-week simple moving averages (SMAs), according to the Into the Cryptoverse weekly moving averages chart. With ETH trading at about $1,820 right now, it is well below both the 50-week SMA at $2,850 and the 20-week SMA at $2,560. Historically, a bearish trend continuation is indicated by being stuck below these averages, which makes any sustained upward move much more difficult.
At the moment Ethereum is trading below nine of the ten major moving averages that are tracked. Until a significant catalyst appears to change the sentiment, this unbalanced situation produces a sort of technical gravity that pulls the price lower. Further layers of resistance are added by the long-term averages such as the 200-week and 250-week SMAs, which are located at $2,450 and $2,220, respectively, and loom above the current price.

Ethereum's upward momentum will continue to be extremely brittle until it can confidently break and hold above these longer-term trendlines. Ethereum might stay in the $1,750-$1,900 range in the near future but risk will remain skewed downward in the absence of a clear breakout above the $2,000 mark. If nothing drastically changes, ETH might find it difficult to join any larger cryptocurrency market rally because of its own technical issues.
 Dan Burgin
 U.Today Editorial Team