Disclaimer: The opinions expressed by our writers are their own and do not represent the views of U.Today. The financial and market information provided on U.Today is intended for informational purposes only. U.Today is not liable for any financial losses incurred while trading cryptocurrencies. Conduct your own research by contacting financial experts before making any investment decisions. We believe that all content is accurate as of the date of publication, but certain offers mentioned may no longer be available.
XRP recently made a move that might raise some questions even among seasoned market observers. On the chart, XRP depicted a candle with massive wicks extending in both directions, a rare occurrence that signals extreme volatility within a very short time frame. This kind of price action can often be attributed to market manipulation, where large players may attempt to influence the market for potential gains.
The unusual activity created a visual anomaly on the charts, disrupting the mostly dull market performance. Such events can trigger stop-loss orders from a multitude of traders, potentially leading to a cascade of buy and sell orders that amplify the currency's volatility. This instance with XRP might have represented a significant liquidity hunt, where large orders target pockets of liquidity found at traders' stop-loss levels before the price returns to its average trading range.
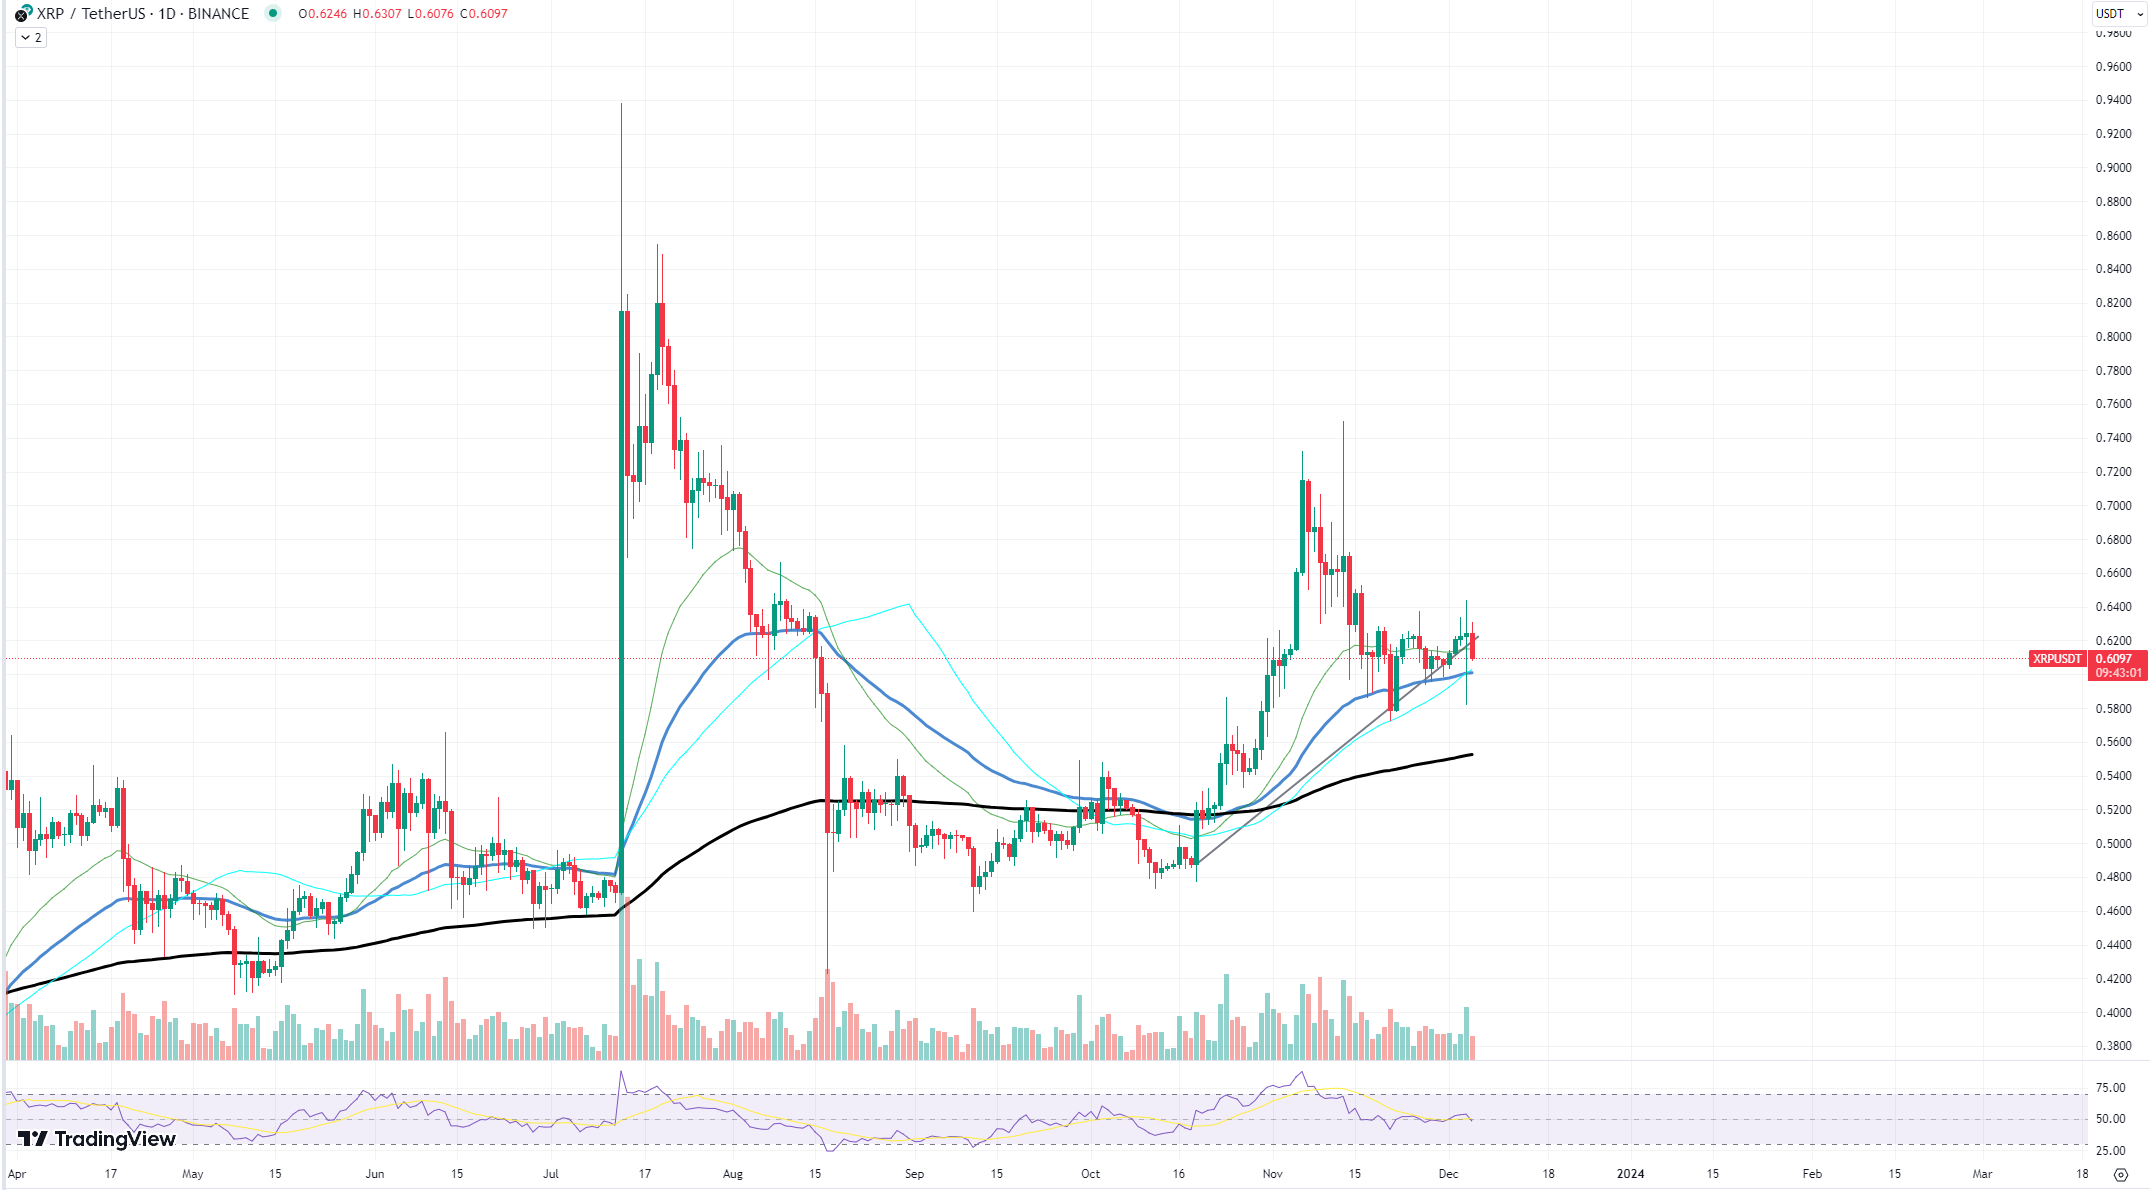
Recently, XRP has been showing a mixed bag of price performance, trading sideways with no clear direction. The presence of such market anomalies, particularly those suggesting market manipulation, can often serve as a precursor to a larger price correction. Traders and investors might interpret these movements as a signal to proceed with caution, as it indicates a market environment that is currently unstable and could turn bearish.
Solana cools off
Solana (SOL) has carved out a distinct upward trajectory, showcasing impressive price performance that has caught the attention of investors and traders alike. Currently hovering around the $60 mark, Solana is in the throes of a consolidation process, a phase typically marked by traders and investors evaluating the asset's future potential and solidifying their positions in anticipation of the next big move.
The chart provided shows Solana's solid performance, as the price maintains its position well above crucial moving averages. This steadfast performance suggests that the digital asset is gearing up for a significant breakthrough. An analysis of the chart reveals that the price action has formed a consistent series of higher lows, an indication of growing confidence among buyers and a potential precursor to a sustained bull run.
Should Solana breach its current consolidation zone, the likelihood of a continued price breakthrough is strong. The cryptocurrency's resilience and steady climb indicate that it might not only sustain its current level but is also poised to ascend toward more ambitious price targets. Investors are keenly watching for signs of a breakout, which could propel Solana closer to its previous all-time highs.
The market sentiment around Solana is buoyed by its robust ecosystem and the increasing adoption of its blockchain for various applications, including decentralized finance (DeFi) and non-fungible tokens (NFTs). This foundational strength, combined with favorable technical indicators, suggests that Solana is cutting through the market noise with a clear upward rally.
Bitcoin's cosmic performance
Bitcoin has been on a remarkable rally, surpassing all kinds of expectations. The leading cryptocurrency has exhibited a strong bullish trend, breaking through resistance levels with an assertive push that has many market watchers reevaluating their forecasts. The chart shows a distinct price rally, with Bitcoin climbing steeply and consistently forming higher highs and higher lows.
The current price level is particularly crucial. Bitcoin is at a juncture that has previously acted as a significant psychological and technical barrier. A breakthrough at this level could confirm sustained bullish momentum, potentially establishing new support zones that could serve as launchpads for further gains. However, the price action also shows extended wicks on the upper side of recent candles, indicating rejection at higher levels, which might precede a reversal.
Furthermore, the trading volume has been inconsistent, with significant spikes on upswings but not consistently supporting the rally. This divergence between price and volume often warns of an upcoming price reversal. Market participants are also keeping a wary eye on macroeconomic indicators and regulatory news that could affect market sentiment and impact Bitcoin's trajectory.
 Dan Burgin
 U.Today Editorial Team