Disclaimer: The opinions expressed by our writers are their own and do not represent the views of U.Today. The financial and market information provided on U.Today is intended for informational purposes only. U.Today is not liable for any financial losses incurred while trading cryptocurrencies. Conduct your own research by contacting financial experts before making any investment decisions. We believe that all content is accurate as of the date of publication, but certain offers mentioned may no longer be available.
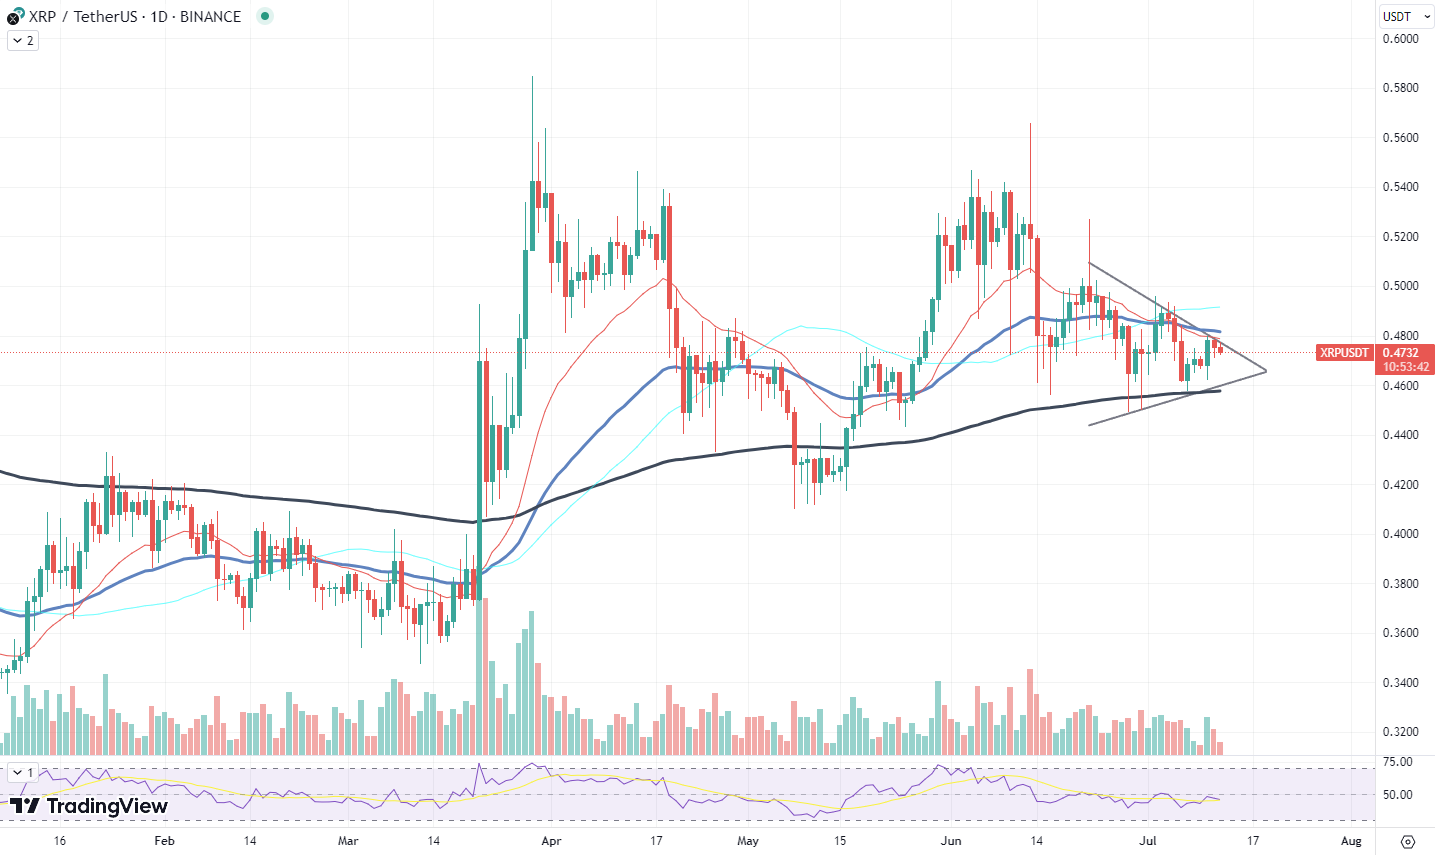
XRP is facing a crucial moment. Per the recent chart analysis, the XRP price is getting squeezed between two significant trendlines, creating a symmetrical triangle pattern. This pattern often leads to a sharp price movement, indicating that a surge might be on the horizon for XRP.
The longer trendline is currently acting as a robust support level, while the shorter one poses a resistance. The convergence of these two trendlines has resulted in a symmetrical triangle, which typically precedes a breakout. The XRP price, currently standing at $0.47, is trading at the heart of this triangle.

Moreover, the trading volume for XRP is in a declining phase. This diminishing volume could indicate a lower trading interest in the current price range, possibly leading to a price breakout to attract more trading activity.
The Relative Strength Index (RSI), a crucial momentum indicator, is hovering around the neutral 50 mark. This positioning does not give a distinct bullish or bearish bias but instead suggests that the market is waiting for a stronger price signal before deciding the direction.
Furthermore, XRP's price is caught between the 50-day and 200-day Exponential Moving Averages (EMAs), another telltale sign of a brewing price squeeze. The 50-day EMA often acts as a short-term trend indicator, while the 200-day EMA is a reliable gauge for a longer-term market direction.
Cardano will have to decide now
Cardano (ADA), the highly popular proof-of-stake blockchain platform, is on the precipice of a critical decision point. Hovering around the $0.3 price resistance level, a mark that it has thrice failed to convincingly breach, ADA has left investors and traders in suspense regarding its next move.
Historically, the $0.3 price point has proven to be a stubborn resistance level for ADA. The last two attempts to break through have led to a trend reversal, with ADA falling by approximately 10% each time. These reversals showcase the selling pressure that ADA has faced at these levels, forcing the price back down as sell orders get triggered.
However, this time, the scenario might be different. Market conditions suggest a possible easing of selling pressure, creating a window for ADA to break through. Lower selling pressure could result in fewer sell orders at the resistance level, allowing buyers to push the price past this stubborn threshold.
That said, the possibility of downward price volatility should not be discounted. Despite the lower selling pressure, a failure to break through the resistance level could still trigger a sell-off among investors looking to cut their losses or take profits, sending ADA's price on another downward trajectory.
Investors drop Ethereum
Ethereum, the world's second largest cryptocurrency by market capitalization, has recently been described as "No Man's Land." The leading smart contracts platform is grappling with some concerning signals, namely declining trading volume and volatility, prompting caution among investors.
Over the past 10 days, Ethereum's trading volume has witnessed a significant downward trend. A robust trading volume is a sign of active market participation and a crucial factor in maintaining price stability. The recent slump in volume suggests a decrease in trader interest and could lead to higher price volatility due to a lack of liquidity.
In an intriguing contrast, while one might expect decreased volume to result in increased volatility, Ethereum's volatility levels have also been trending downward. Price volatility, which measures the degree of variation in a trading price series over time, is a critical element in setting asset prices. Lower volatility often indicates a less risky investment, but in the case of Ethereum, it might also signal a lack of market direction and investor uncertainty.
This combination of decreasing trading volume and volatility positions Ethereum in what traders often refer to as "No Man's Land." It is a state of limbo, a zone of uncertainty, where clear market trends are hard to discern. In this territory, traders and investors typically tread with caution, waiting for a clear signal before making their next move.


 Arman Shirinyan
 Alex Dovbnya
 Denys Serhiichuk