Disclaimer: The opinions expressed by our writers are their own and do not represent the views of U.Today. The financial and market information provided on U.Today is intended for informational purposes only. U.Today is not liable for any financial losses incurred while trading cryptocurrencies. Conduct your own research by contacting financial experts before making any investment decisions. We believe that all content is accurate as of the date of publication, but certain offers mentioned may no longer be available.
The market has become even more bearish since yesterday; almost all of the Top 10 coins are in the red except for Polkadot (DOT), which remains trading in the green zone, rising by 1%.
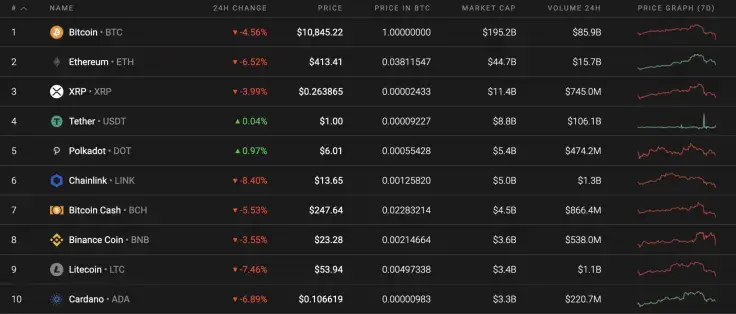
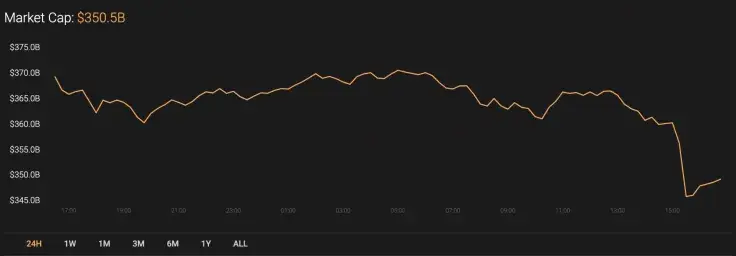
The total cryptocurrency market capitalization has also declined by almost $20 bln. The current index accounts for $350 bln.
The key data of XRP is looking the following way:
-
Name: XRP
Advertisement -
Ticker: XRP
-
Market Cap: $11,881,356,680
-
Price: $0.263964
Advertisement -
Volume (24h): $1,560,326,322
-
Change (24h): -3.28%
The data is relevant at press time.
XRP/USD: Will bears dump the coin below $0.25?
XRP has lost the least among the Top 3 coins. The third most popular crypto has lost 3.28% of its price share, which is much less than the price change of Bitcoin (BTC) and Ethereum (ETH).
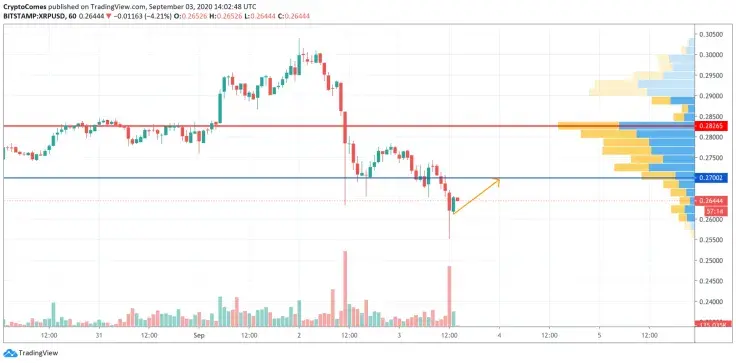
On the hourly chart, XRP has bounced off the support zone at $0.2555. At the moment, there is great potential to see a correction after a sharp decline. The liquidity is low, which supports the idea of a price rise to the support at $0.27. However, that will be just a bounce off, but not the start of continued growth.
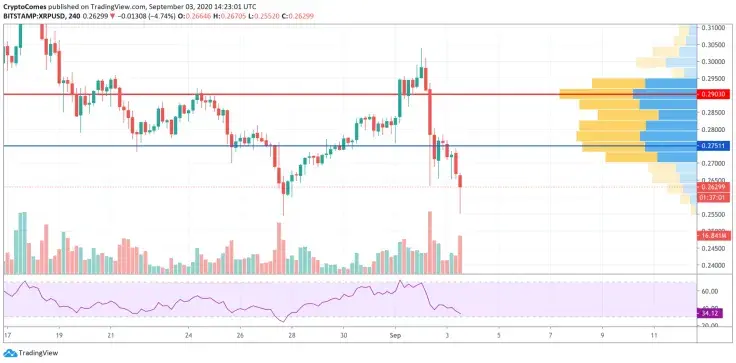
On the 4H time frame, a correction is also more likely than a drop. The Relative Strength Index indicator is almost on the verge of the oversold area, which means that bulls may seize the initiative in the short-term perspective. In that case, a rise may take XRP to the mark of $0.27.
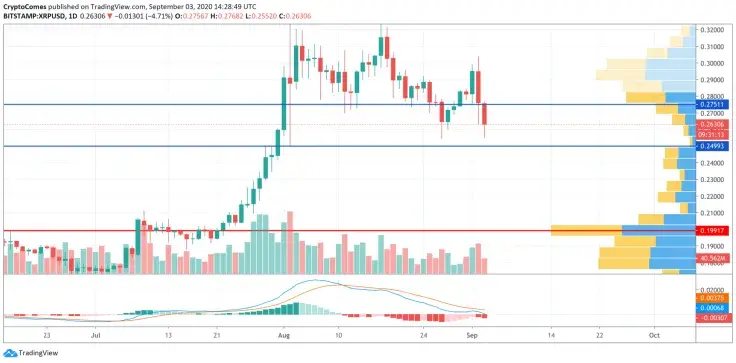
On the daily chart, the situation is reversed. The crucial support level of $0.25 has not been attained, which means that bulls may try to test it again.
Thus, the MACD indicator is located in the bearish wave without any signals of a potential reversal. All in all, the main scenario is a retest of the $0.25 mark before continued growth.
XRP is trading at $0.2630 at press time.
 U.Today Editorial Team
 Dan Burgin