Disclaimer: The opinions expressed by our writers are their own and do not represent the views of U.Today. The financial and market information provided on U.Today is intended for informational purposes only. U.Today is not liable for any financial losses incurred while trading cryptocurrencies. Conduct your own research by contacting financial experts before making any investment decisions. We believe that all content is accurate as of the date of publication, but certain offers mentioned may no longer be available.
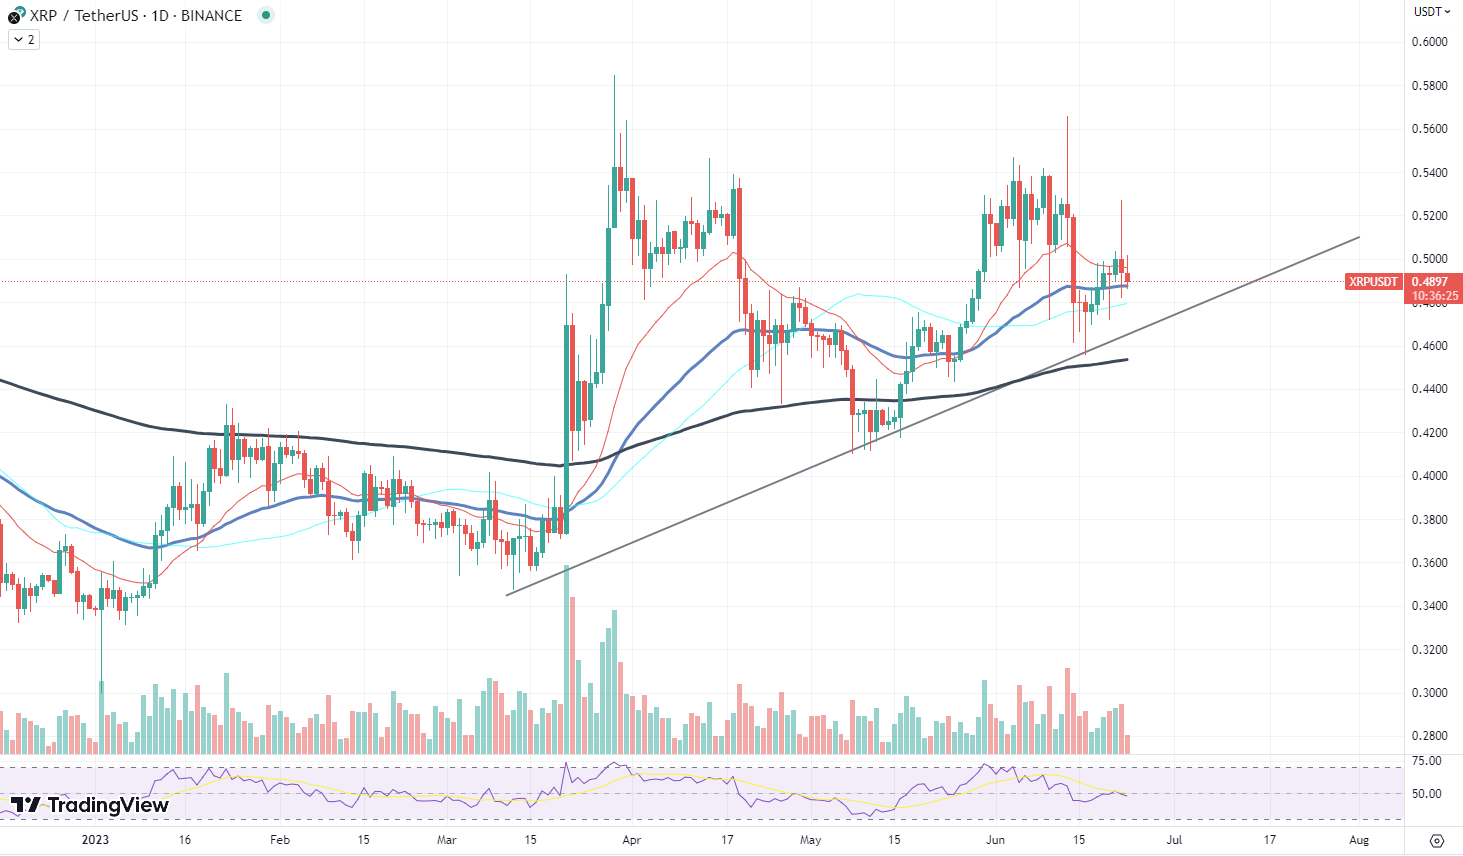
XRP has caught the attention of traders and market analysts as it appears to be forming a reversed Head and Shoulders (H&S) pattern on its price chart. This development, widely recognized in the world of technical analysis, can provide key insights into the cryptocurrency's future price direction.
Typically, a standard H&S pattern represents a bearish reversal, where prices may drop following the pattern's completion. It consists of three peaks: a higher peak (head) flanked by two lower peaks (shoulders). However, in the case of XRP, we are observing a reversed H&S pattern. This inversion signals a bullish scenario, suggesting a potential rally after the pattern is completed.

The second shoulder, indicating the pattern's near completion, has already been formed. This means that XRP could soon be heading toward an uptrend if the pattern plays out as expected. However, it is crucial to note that patterns are not guaranteed predictors but probabilistic tools used to gauge potential price movements.
In terms of price performance, XRP, much like other cryptocurrencies, has been navigating through a volatile landscape. Despite significant price fluctuations, XRP's progress on the H&S pattern underscores the possibility of a trend reversal.
Interestingly, XRP's volume has been descending, which aligns with the H&S pattern's typical progression. A decrease in volume is often observed during the formation of the second shoulder. Once the pattern completes, and if a breakout occurs, it is common to see a significant surge in volume.
Cardano's strong rally
Cardano (ADA), the proof-of-stake blockchain platform, has been experiencing an impressive rally in the past few days. Despite the turmoil on the broader crypto market, ADA has charted a growth trajectory for five consecutive days, showing resilience and strength in its performance.
Amid the ebb and flow of the crypto market, where corrections are the norm, Cardano has been defying the trend. Its steady ascension suggests robust demand for ADA, which is fueling its rise despite the market's inherent volatility.
The continuous growth of ADA has been drawing increased attention, especially given that many other digital assets are experiencing corrections following their respective rallies. Cardano's resistance to a similar trend demonstrates its unique market dynamics and possibly highlights the growing investor confidence in the asset's potential.
However, it is essential to put this rally into context. Notably, ADA's growth comes after a significant value drop following the Securities and Exchange Commission's (SEC) complaint against Coinbase. In the aftermath of being labeled as a "security" by the SEC, Cardano lost more than 33% of its value, a substantial dip that was felt by the entire Cardano community.
The labeling stirred up concerns among investors, given the stricter regulations and requirements associated with securities. Yet, despite this major setback, Cardano has managed to embark on an upward journey, reinforcing its status as a resilient digital asset in the cryptocurrency market.
Ethereum loses to BTC
Ethereum (ETH), despite recently climbing above $1,800, has lost about 11% against Bitcoin (BTC). The implications of this occurrence are far-reaching and may offer profound insights into the current state of the cryptocurrency market.
While Ethereum's price in USD terms is certainly relevant, the ETH/BTC ratio also plays a crucial role. This ratio represents Ethereum's price relative to Bitcoin. When the ratio rises, it means that ETH is outperforming BTC, and when it falls, BTC is leading the way. Thus, an 11% drop in this ratio signifies that, despite Ethereum's USD gains, it is losing ground against Bitcoin.
Interestingly, some analysts suggest that the BTC/ETH ratio can be used as a risk indicator for the cryptocurrency market. According to this view, a rising ratio (ETH outperforming BTC) would indicate a higher risk appetite among investors, as they are willing to invest in more volatile and potentially high-reward assets like Ethereum.
On the other hand, a falling ratio (BTC outperforming ETH) could signal a derisking mode, with investors gravitating toward the relative stability of Bitcoin.


 Vladislav Sopov
 Dan Burgin