Disclaimer: The opinions expressed by our writers are their own and do not represent the views of U.Today. The financial and market information provided on U.Today is intended for informational purposes only. U.Today is not liable for any financial losses incurred while trading cryptocurrencies. Conduct your own research by contacting financial experts before making any investment decisions. We believe that all content is accurate as of the date of publication, but certain offers mentioned may no longer be available.
In a significant development for the world's second-largest cryptocurrency, Ethereum (ETH) has successfully breached an enormous resistance level at the 200 Exponential Moving Average (EMA). This event marks an important step for the coin, boosting its prospects for a bullish rally in the coming days.
Ethereum has had a volatile journey this year, facing numerous technical and fundamental challenges. However, its recent surge to $1,812 reveals a promising uptrend that could set the stage for a much-needed revival. This breakthrough at the 200 EMA resistance level signifies strong momentum in favor of ETH.
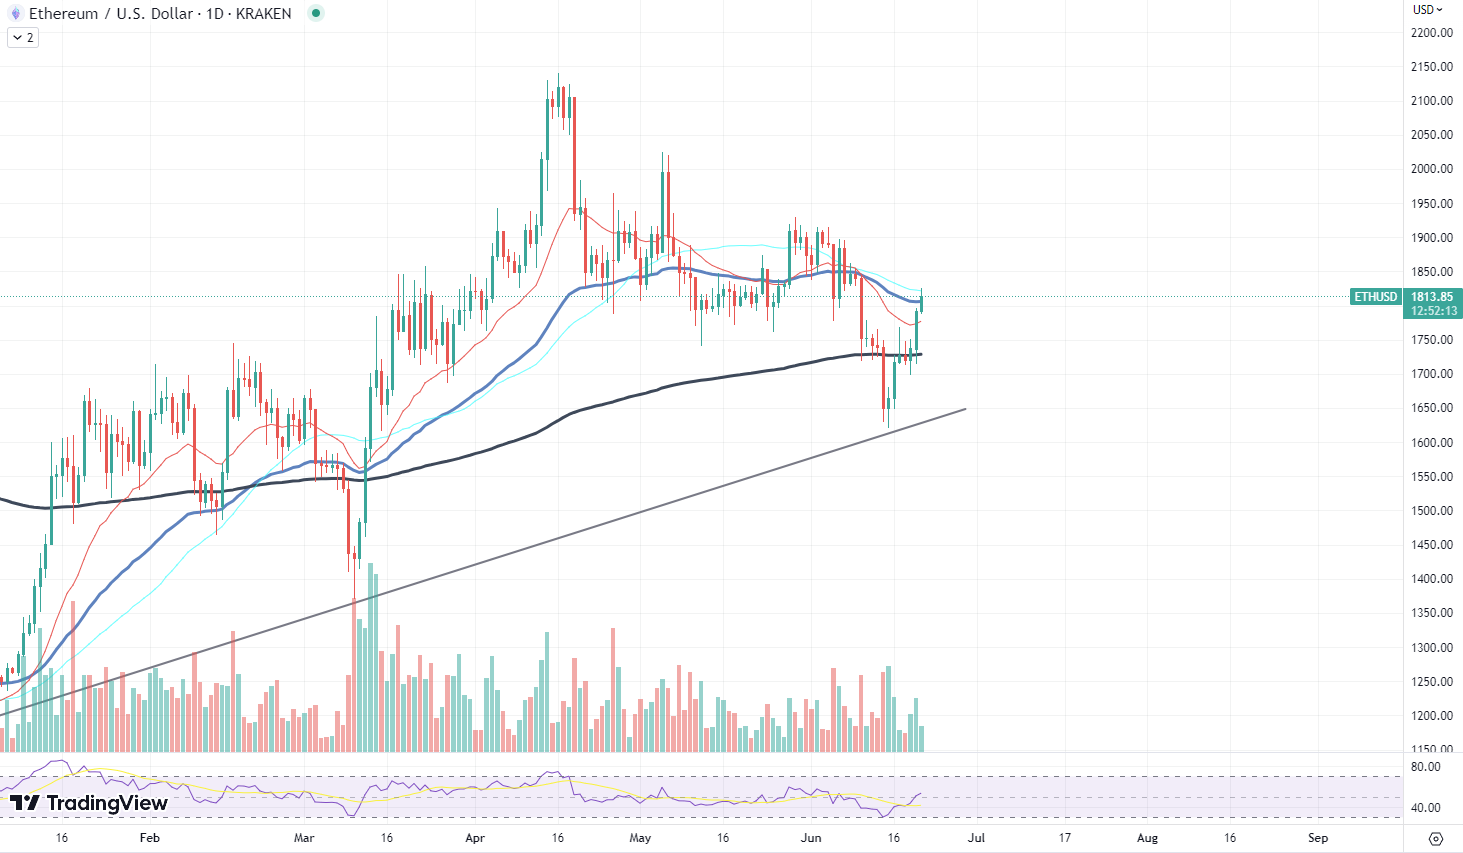
Technical indicators underscore this optimistic sentiment. The Relative Strength Index (RSI), a key measure of momentum, has entered the oversold zone. This suggests that the ETH token might have been undervalued, leading to increased buying pressure that could continue to propel prices upward.
While the break above the 200 EMA is a positive signal, it is important to remember that these levels often act as dynamic support and resistance, potentially leading to a retest in the future. Should Ethereum continue its upward trend, it could set a new foundation for further growth, attracting a new wave of investors eager to capitalize on this momentum.
Bitcoin's dominance surges
The cryptocurrency market is currently experiencing a resurgence of Bitcoin (BTC) dominance as the world's leading digital asset sees its market share exceed 51%. This increasing dominance suggests that Bitcoin could suppress altcoins in the near term, as investors may find it more attractive, given its correlation with price performance.
The rise of Bitcoin's dominance index, which measures BTC's market share against the total value of all cryptocurrencies, has often been perceived as an indicator of investor confidence in Bitcoin. As the index rises, it suggests that investors are shifting their capital from altcoins into Bitcoin, typically due to its established reputation, liquidity and robust infrastructure.
While this could potentially result in a short-term decrease in altcoin prices, the long-term implications remain unclear. Historically, Bitcoin dominance has gone through cycles of increase and decrease, often influencing the altcoin market. As Bitcoin dominance rises, altcoins usually suffer, but when the dominance falls, it is often a sign of the start of an "altcoin season," where alternative cryptocurrencies see a significant surge in price.
The renewed dominance of Bitcoin comes at a crucial time when the crypto market is seeing considerable volatility. While many attribute this to a variety of factors, including regulatory news and macroeconomic indicators, the underlying factor appears to be ongoing faith in Bitcoin's value proposition.
XRP paints top
The XRP cryptocurrency has recently formed a popular pattern on its price chart. Observers have identified a "spinning top" candlestick pattern, which comes as the digital currency is on an ascending trend over the past week and has managed an 8% rise in its value. Trading at $0.49, XRP is now just shy of the significant $0.50 mark, sitting above its 50-day Exponential Moving Average (EMA) but below the 21-day EMA.
The spinning top pattern is a notable occurrence in technical analysis, known for its potential to precede a change in the asset's price direction. The pattern takes its name from its resemblance to a child's toy and occurs when the upper and lower shadows of a candlestick are long while the body is small. This pattern indicates a state of indecisiveness on the market, with neither buyers nor sellers gaining the upper hand.
What makes the pattern particularly interesting for XRP is its emergence during an ascending price trend. The formation of a spinning top in this context suggests that while XRP has been gaining, the market is showing signs of uncertainty. A close above or below the spinning top in subsequent trading sessions could indicate the market's decision: a bullish or bearish move.
 Dan Burgin
 U.Today Editorial Team