Disclaimer: The opinions expressed by our writers are their own and do not represent the views of U.Today. The financial and market information provided on U.Today is intended for informational purposes only. U.Today is not liable for any financial losses incurred while trading cryptocurrencies. Conduct your own research by contacting financial experts before making any investment decisions. We believe that all content is accurate as of the date of publication, but certain offers mentioned may no longer be available.
XRP, the fifth largest cryptocurrency by market capitalization, seems to be portraying oversold signals.
This is as the four-hour chart displays the similitude of a "death cross" pattern, which happens when the moving average MA 50 falls below the moving average MA 200. This is regarded as a bearish indication, but instances for XRP prove otherwise.
The majority of XRP's so-called "death crosses" have culminated in the crypto asset's bottoming phase. Moving average crossovers are referred to by some as "lagging indicators," as most of the time the crypto asset would have been oversold or overbought before it happened.
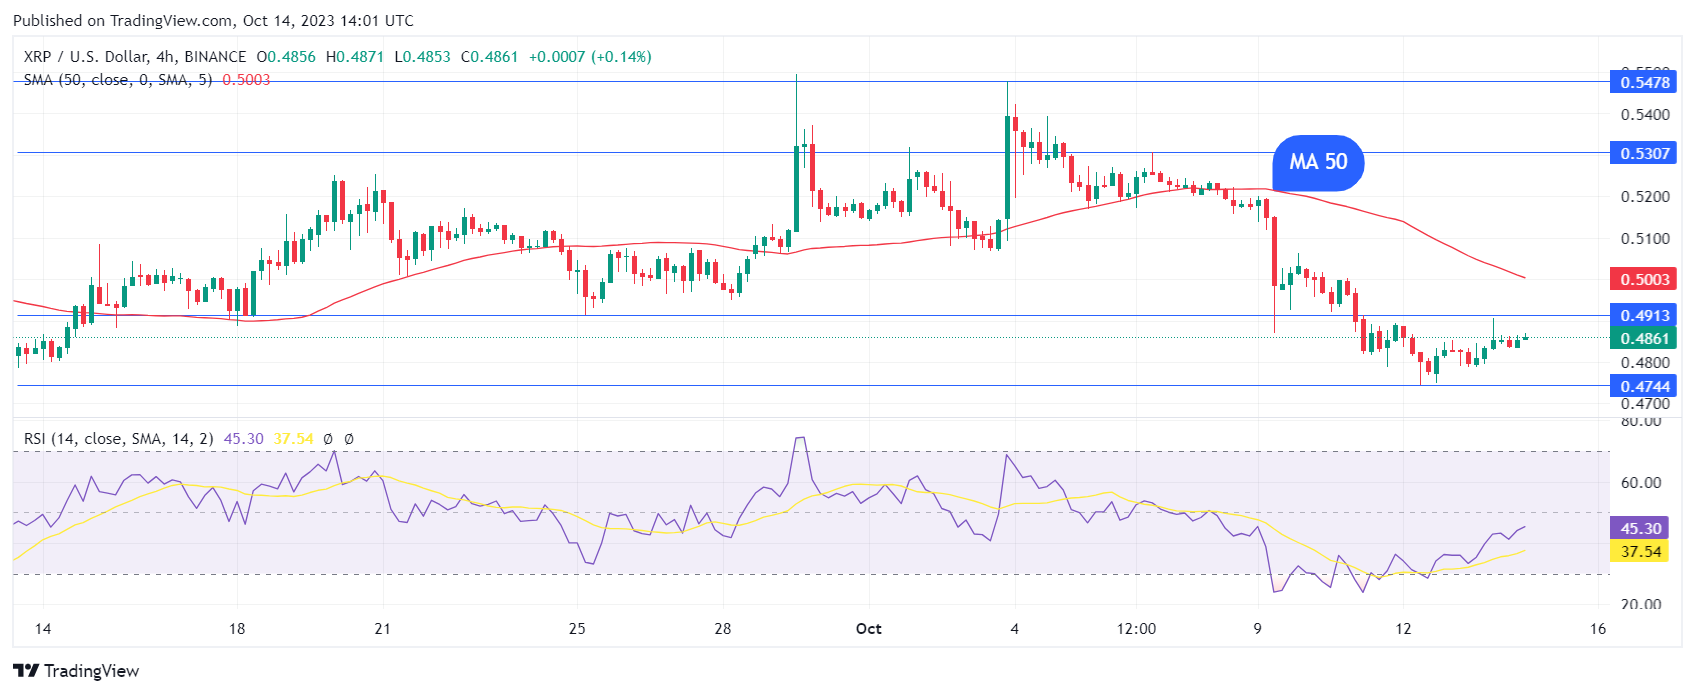
After six straight days of trading in the red, XRP appears oversold and may stage a short-term rally. However, a look at the four-hour chart depicts something interesting: XRP is consolidating in a narrow range.

While the short term remains uncertain, traders may need to pay close attention because most consolidations are typically followed by major breakouts.
However, predicting the direction of the breakout with certainty may be challenging. Given that the bulls have not allowed XRP to fall below $0.47 in recent weeks, the possibility of an upside breakout grows.
XRP daily chart
XRP fell to lows of $0.4733 on Oct. 12 in a six-day losing streak. Bulls returned Oct. 13 as the XRP price turned green for the first time in seven days. Bulls consolidated on the rise, while XRP sustained in green at press time.
XRP is presently trading at $0.486, up 0.87% in the last 24 hours. If the rebound gains traction, a break and close above the moving averages will be the first indicator of strength.
The bulls will then make one more try to push the price up to the overhead barrier of $0.56. A break and closing above this level will signal the beginning of a fresh, possible uptrend.
If bears succeed in pushing XRP below the $0.47 level, the support at $0.46 may come into view next, but if it breaks, XRP may fall to the crucial level at $0.41, where bulls may aggressively buy the dip.
 Dan Burgin
 U.Today Editorial Team