Disclaimer: The opinions expressed by our writers are their own and do not represent the views of U.Today. The financial and market information provided on U.Today is intended for informational purposes only. U.Today is not liable for any financial losses incurred while trading cryptocurrencies. Conduct your own research by contacting financial experts before making any investment decisions. We believe that all content is accurate as of the date of publication, but certain offers mentioned may no longer be available.
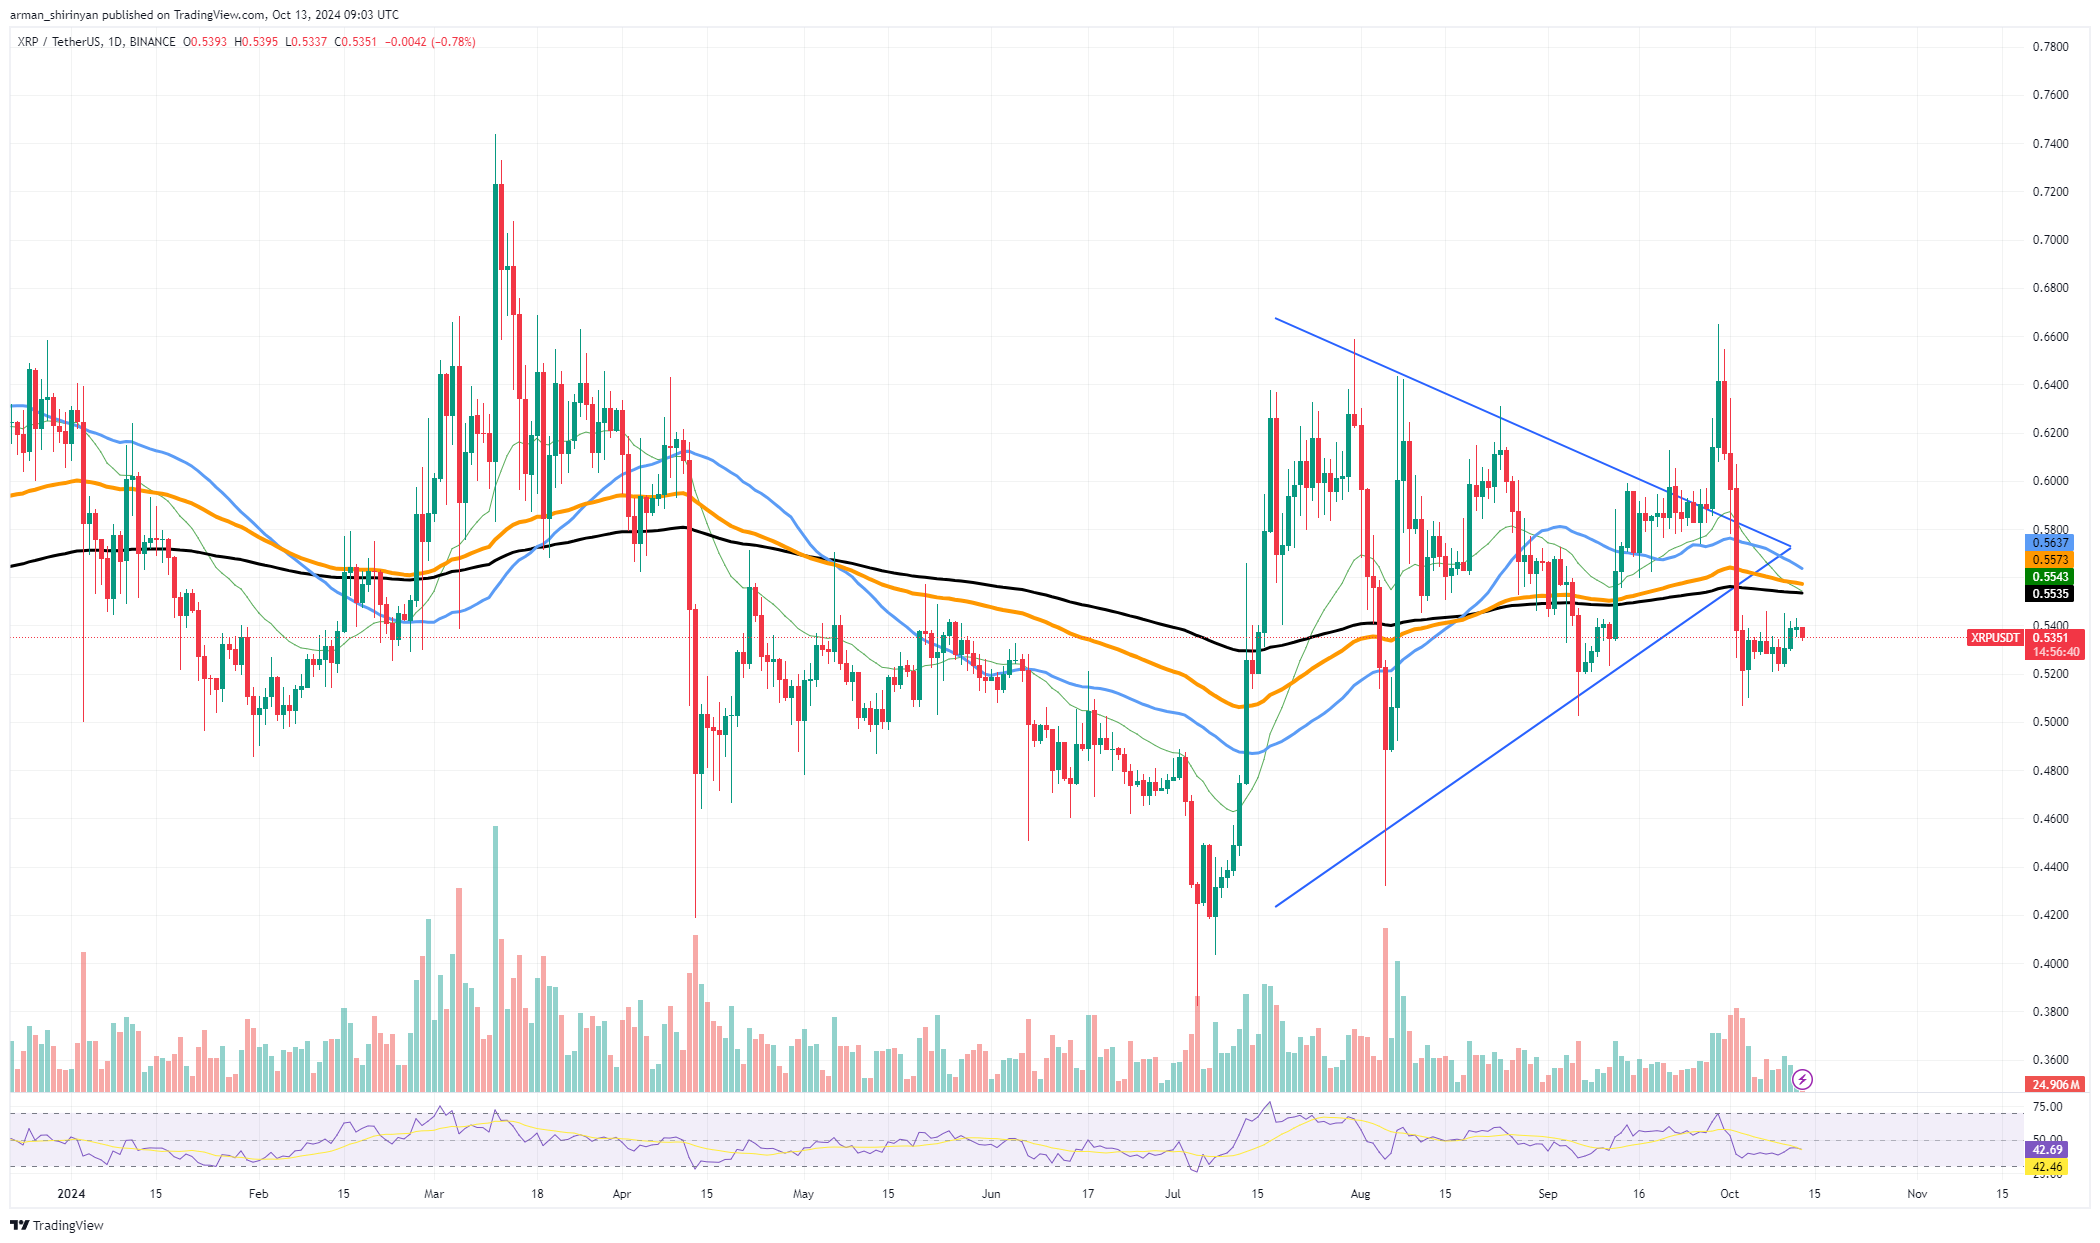
Next week marks a turning point in the price action of XRP with multiple important factors that could have a big impact on its short-term performance. The provided chart shows that following a significant decline in late September, the asset has been consolidating around the $0.53 mark.
A spike in volatility the following week could change the perception of XRP, an asset that has had difficulty breaking above important resistance levels. The capacity of XRP to maintain a price above the $0.52 support level is currently one of its key advantages. The price has repeatedly tested this area, but it has been able to stay stable and has not broken down any further.

The 100 and 200-day moving averages as well as other moving averages that are positioned slightly below the current price are additional sources of support for XRP. Should more downside pressure come, these moving averages may serve as safety nets for the asset. A possible near-term breakout scenario is indicated by the wedge pattern formation. Given the recent sideways movement of XRP, a breakout could happen in either direction. Sharp movements are frequently preceded by wedge patterns.
If a bullish breakout occurs, the chart's upward-sloping trendline could serve as XRP's springboard as it surges higher, possibly aiming for the $0.57 and $0.60 levels. Given that XRP was unable to maintain its recent increase above the $0.60 barrier, there is a significant risk of decline. The market's lack of strong buying support was indicated by the sharp decline that followed the failure to break above this critical resistance last month.
Bearish sentiment may take hold if XRP is unable to maintain above the $0.52 support and further declines toward the $0.50 or even $0.45 range occur. In addition, the chart's Relative Strength Index (RSI), which measures traders' indecision, is presently in neutral territory. The price may come under more pressure and see a bigger sell-off if the RSI enters the oversold area.
A wedge pattern and a contracting price range indicate an impending breakout. A strong move toward $0.60 or higher may be visible to traders if positive momentum returns and XRP can close above $0.55 in the upcoming days.

 Arman Shirinyan
 Dan Burgin
 Alex Dovbnya
 Tomiwabold Olajide