Disclaimer: The opinions expressed by our writers are their own and do not represent the views of U.Today. The financial and market information provided on U.Today is intended for informational purposes only. U.Today is not liable for any financial losses incurred while trading cryptocurrencies. Conduct your own research by contacting financial experts before making any investment decisions. We believe that all content is accurate as of the date of publication, but certain offers mentioned may no longer be available.
XRP is currently facing a critical crossroads. The question is whether XRP can maintain its position at the $0.5 mark or if the recent breakdown below multiple moving averages signals a more substantial retreat.
At a glance, the XRP chart displays a troubling picture for bulls. The asset has recently faltered below several key moving averages, which traditionally act as layers of support. The 50-day, 100-day and 200-day moving averages have now turned into resistance levels, which XRP would need to overcome to reclaim bullish momentum. These moving averages, particularly the 200-day, are closely watched by traders and can often dictate the medium to long-term trend direction.
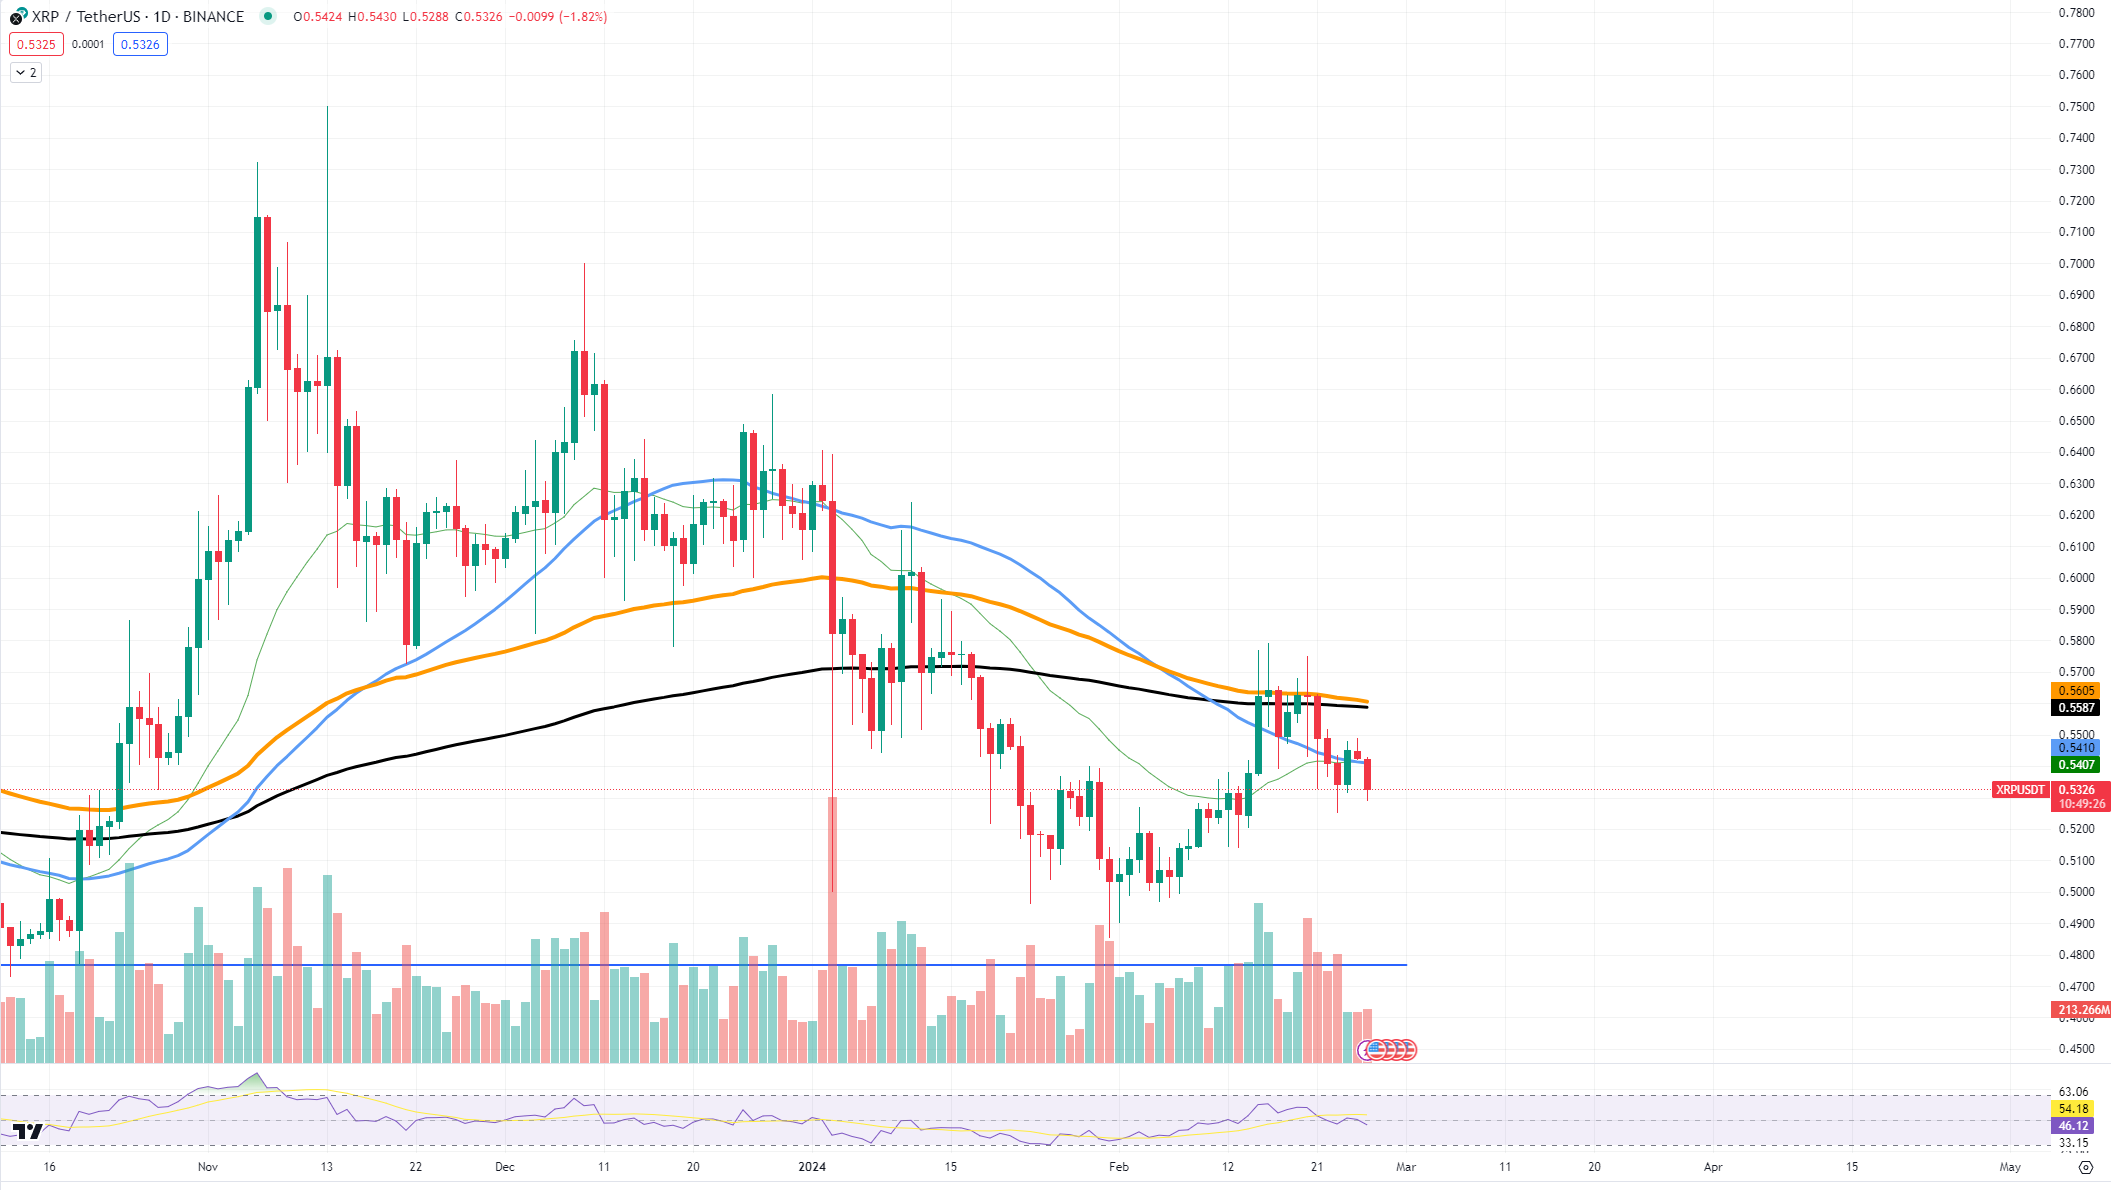
The current resistance levels are set near $0.5587 and $0.5850, which represent recent local highs and the proximity of the 50-day moving average. A successful break and close above these points could signal a potential reversal of the recent downtrend. Conversely, the support levels to watch are at $0.4700 and $0.4500, where buyers have historically shown interest.
If XRP can consolidate and push back above the $0.5 threshold, it would need to sustain the upward movement and close above the aforementioned moving averages. This could instill confidence among traders, potentially igniting a rally toward higher resistance levels.
Dangerous growth
The U.S. Dollar Index serves as a barometer for the strength of the dollar against a basket of foreign currencies and often has an inverse correlation with the cryptocurrency market. Recently, technical analysts have been eyeing the formation of a "Golden Cross" on the DXY chart — a bullish signal where the 50-day moving average crosses above the 200-day moving average. If this pattern comes to fruition, it could spell trouble for the cryptocurrency market, traditionally sensitive to a strengthening dollar.
The DXY chart currently shows the index hovering around the 103.87 mark, with the 50-day moving average creeping toward the 200-day moving average. A Golden Cross formation would typically indicate that a long-term uptrend is on the horizon for the dollar, suggesting increased buying momentum.
The link between the DXY and cryptocurrencies is evident; a stronger dollar often leads to a decrease in the price of digital assets like Bitcoin and Ethereum. Investors typically flock to the security of the dollar in uncertain economic times, which can result in a pullback for risk-on assets like cryptocurrencies. If the Golden Cross in the DXY indeed materializes and triggers a dollar rally, the cryptocurrency market may see a corresponding downturn as capital flows out of digital assets and into the traditional refuge of fiat currency.
Cardano no longer bullish
Cardano has recently exhibited signs of a trend reversal, stepping out of its bullish mode. This shift in momentum has prompted discussions among investors and traders as they reassess the asset's near-term prospects.
After a period of sustained upward movement, ADA has broken below its rising channel, a structure that typically signifies bullish sentiment. This breakout to the downside indicates a potential shift to bearish momentum or at least a pause in the uptrend. The price is now hovering around $0.575, just below the lower boundary of the former channel, suggesting a possible new resistance level.

Looking at support levels, the immediate one is at $0.5385, which is critical for ADA to hold to prevent further declines. A break below this support could lead to a test of the next support level at around $0.5112, where the 50-day moving average may offer some buoyancy to the price.
Cardano's current trajectory points to a cooling-off period following its exit from the bullish channel. The volume profile shows a decrease during this downturn, potentially signaling a lack of conviction among sellers. However, for ADA to regain its bullish stance, it would need to reenter the channel and sustain a push above the $0.60 mark, challenging recent highs around $0.68.
 Dan Burgin
 U.Today Editorial Team