Disclaimer: The opinions expressed by our writers are their own and do not represent the views of U.Today. The financial and market information provided on U.Today is intended for informational purposes only. U.Today is not liable for any financial losses incurred while trading cryptocurrencies. Conduct your own research by contacting financial experts before making any investment decisions. We believe that all content is accurate as of the date of publication, but certain offers mentioned may no longer be available.
Bitcoin (BTC) has failed to conquer the $10,000 mark once again, which has immediately affected the whole cryptocurrency market. As a result, all of the top 10 coins are in the red zone.
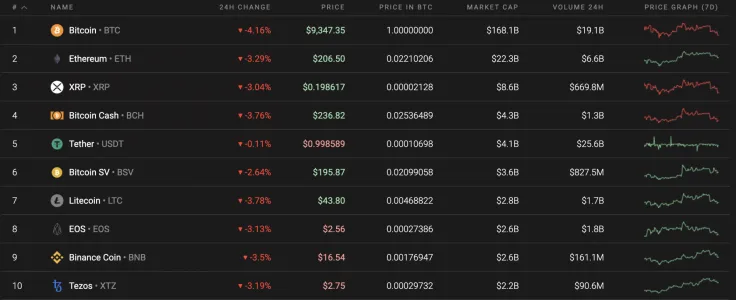
Here are the important statistics for Bitcoin (BTC), Ethereum ETH), and XRP.
|
Name |
Ticker Advertisement
|
Market Cap |
Price |
Volume (24h) Advertisement
|
Change (24h) |
|
Bitcoin |
BTC |
$171 208 480 688 |
$9 313.71 |
$37 663 528 171 |
-4.87% |
|
Ethereum |
ETH |
$22 901 439 168 |
$206.28 |
$12 606 862 128 |
-4.21% |
|
XRP |
XRP |
$8 777 092 398 |
$0.198969 |
$1 739 410 950 |
-3.77% |
BTC/USD
On the 4-hour chart, Bitcoin (BTC) quotes are stuck within the Triangle model. For the development of downward movement, it is important to see a breakdown of the lower boundary of the model with the price holding below $9,050, in which case we can expect a continued decline to the target at $8,180.
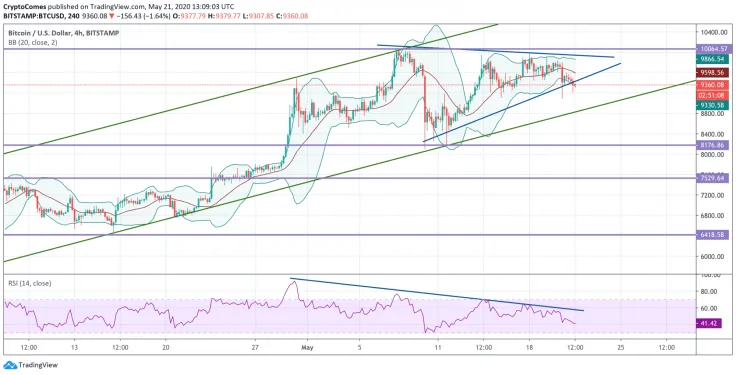
In favor of this scenario, a rebound from the trend line on the RSI indicator emerges. If we don't see the value of Bitcoin (BTC) fall, another possible option will be a breakdown of the upper boundary of the Triangle model with quotes holding above $10,075, at which point we can expect continued growth to $10,565.
Bitcoin is trading at $9,225 at press time.
ETH/USD
On the daily chart, Ethereum (ETH) quotes again pushed off the lower border of the Bollinger Bands indicator, which indicates the presence of a bullish impulse. However, there is potential for the formation of a Double Peak reversal pattern. To complete the model, it is important to see a breakdown of the support level with the price hold below $176, in which case we can expect a further drop in the value of the asset to the target at $148.
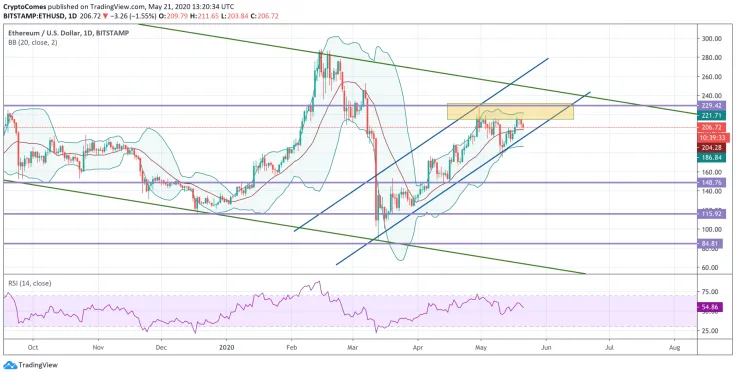
An additional signal in favor of such a scenario may be a rebound from the trend line on the RSI indicator. Cancellation of this option will be a breakdown of the resistance level with the price holding above $235, which will indicate a halt in the formation of the reversal pattern and a continued rise of quotations to the target at $287.
Ethereum is trading at $203.26 at press time.
XRP/USD
XRP is no longer the third most popular coin, according to CoinMarketCap, as Tether (USDT) has replaced it. However, that has not affected its rate much at all. Moreover, XRP has shown much better price dynamics than Bitcoin (BTC) and Ethereum (ETH).
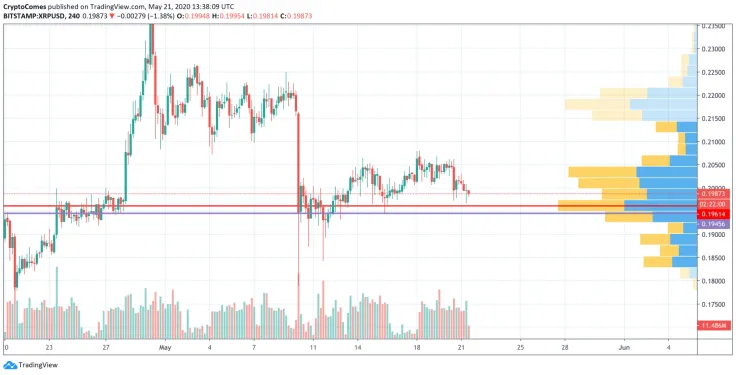
On the 4H time frame, XRP has continued trading in a sideways trend. However, bearish signals are becoming more visible. The trading volume keeps going down and the liquidity level is also low. Traders can most likely expect a drop to the $0.19-$0.1950 zone. If bulls can resist, the bullish short-term trend is likely to continue.
XRP is trading at $0.1961 at press time.
 Dan Burgin
 U.Today Editorial Team