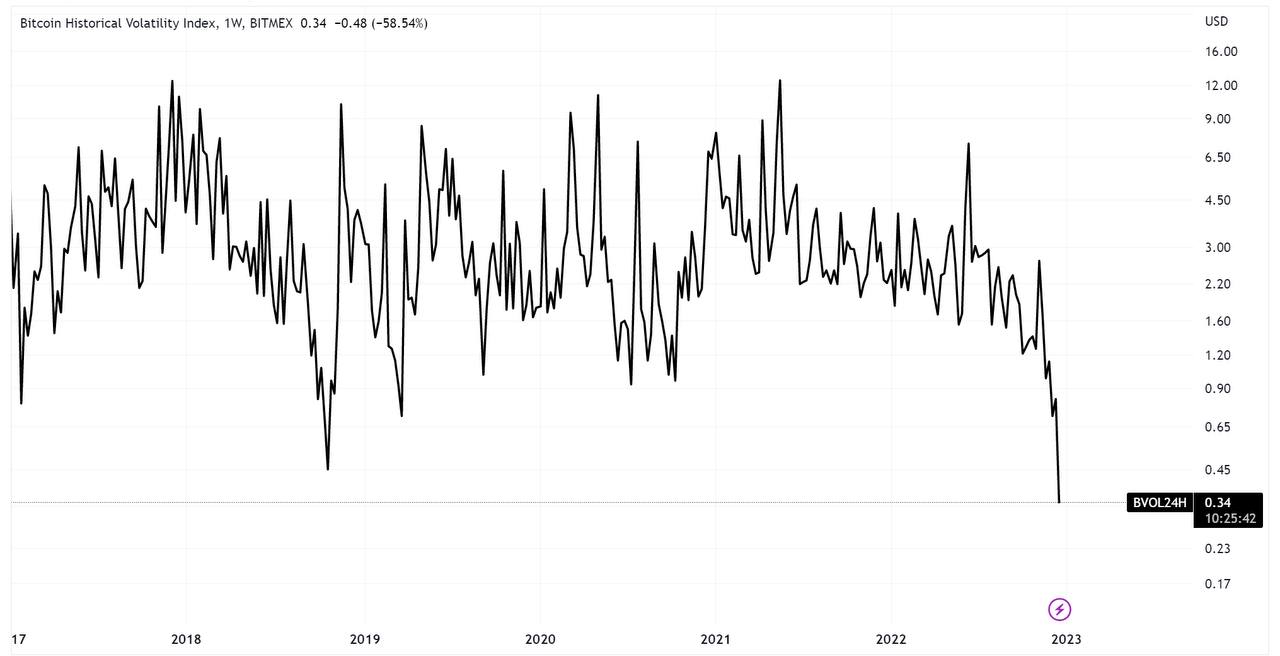
According to a tweet from CryptoCommandr, a cryptocurrency trader and on-chain analyst, every time Bitcoin (BTC) volatility has fallen below 1, it has been followed by a bullish rally, with one exception — October 2018.
Bitcoin experienced a 50% decline in October 2018, and data shows that a rally is likely to occur 75% of the time in such a situation.
Currently, Bitcoin's volatility is at its lowest point in history, and the market is seemingly waiting for the next major move.

This scenario mirrors the bear market of late 2018. Volatility collapsed in October 2018 before surging again when Bitcoin dropped to the low point of $3,200 in December 2018, which was the last stage of the previous bear market.
Bitcoin volatility is the degree of variation in the price of Bitcoin over time. It reflects how much the price has changed over a certain period, usually measured by calculating the standard deviation of logarithmic returns. High volatility indicates that there is significant risk associated with investing in Bitcoin.
The most commonly used measure of Bitcoin volatility is the rolling 30-day annualized standard deviation of daily logarithmic returns, which ranges from 0 to 1. This calculation is based on past Bitcoin price movements.
No bottom yet?
CryptoCommandr believes it could still be quite a while before the bottom is reached. At press time, Bitcoin is trading slightly above the $16,000 level.
The largest cryptocurrency is down more than 75% from its record high that was achieved back in October.

 Tomiwabold Olajide
 Alex Dovbnya
 Arman Shirinyan