Disclaimer: The opinions expressed by our writers are their own and do not represent the views of U.Today. The financial and market information provided on U.Today is intended for informational purposes only. U.Today is not liable for any financial losses incurred while trading cryptocurrencies. Conduct your own research by contacting financial experts before making any investment decisions. We believe that all content is accurate as of the date of publication, but certain offers mentioned may no longer be available.
After a daily loss of 1.83% Stellar's price is currently at $0.22, aggravating the bearish state of the asset. As a result of the overall decline in the market, XLM is now in danger of a death cross, a bearish technical signal that appears when the 50-day moving average falls below the 200-day moving average. The gap between XLM's 50-day MA and 200-day MA is closing quickly.
The bearish trend may intensify and investor confidence may be further shaken if this death cross appears in the next few days. XLM has already broken below its 100-day and 200-day MAs which were serving as dynamic support levels earlier according to technical analysis. The asset is in a precarious position since moving averages and resistance are currently stacked above the current price levels.
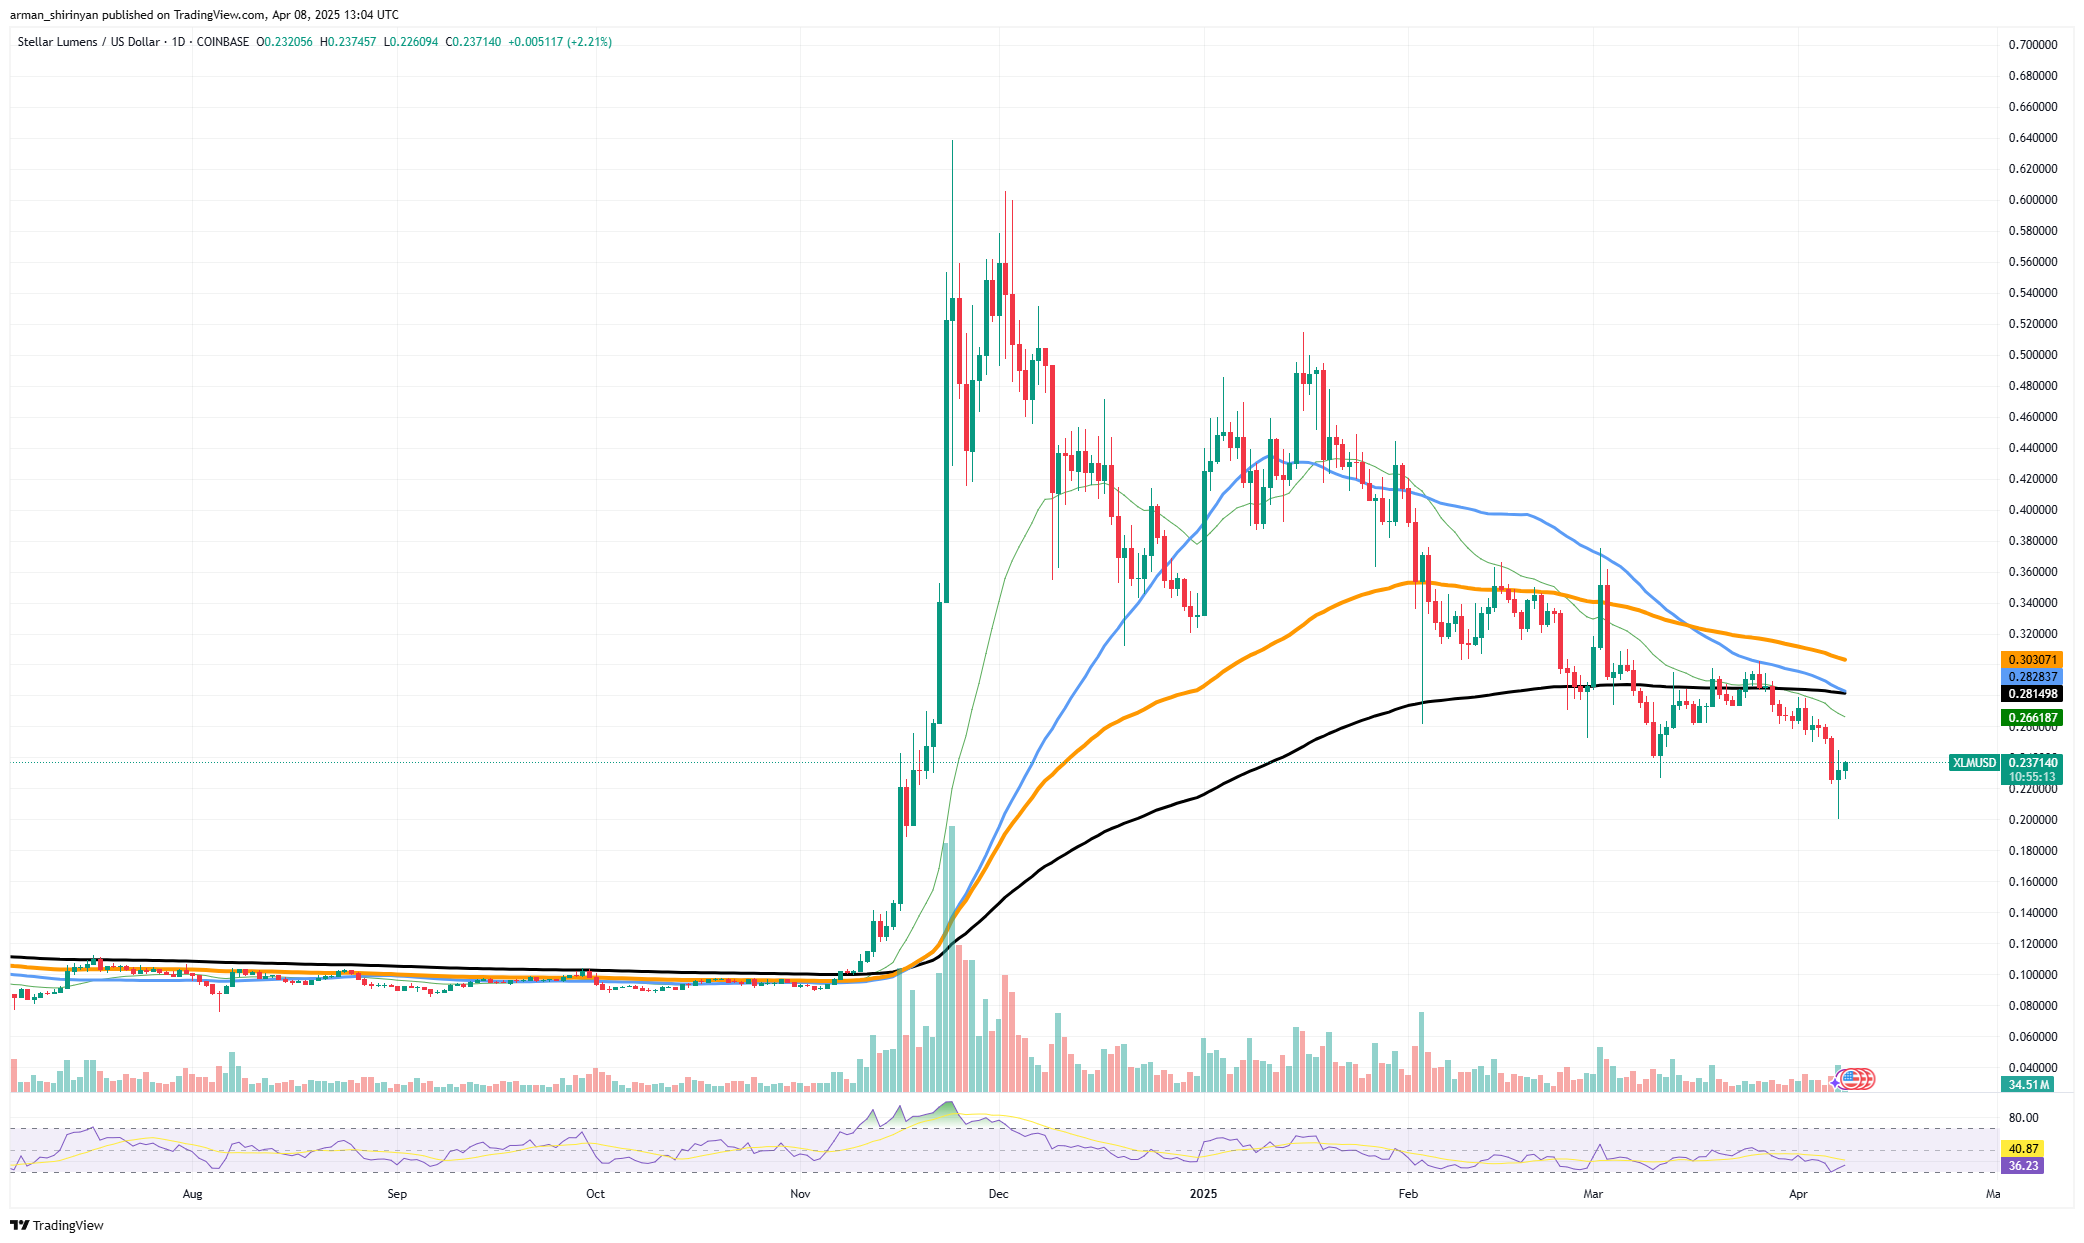
Around $0.20 is the next crucial support level; it is a historical and psychological price point that, if broken, could either invite a series of additional losses or cause a bounce. The Relative Strength Index (RSI) which is approaching oversold territory at 32 adds to the cautious outlook. Although this implies that there may be a brief recovery it also implies that bears may still push lower before experiencing full exhaustion.
Shiba Inu must take action
Given that market signals suggest that there may be a breakout or a breakdown Shiba Inu is at a critical juncture. With the help of a noticeable rise in trading volume SHIB is now exhibiting indications of possible upward movement following days of sideways movement and a recent decline to the $0.000011 level.
As per the chart SHIB is currently trading at around $0.00001132 and is positioned marginally above a historically robust support level. On several occasions in the last few months this area has served as a rebound point. Curiously trading volume increased dramatically as SHIB retested this level suggesting rekindled investor interest and potential whale accumulation.

The spike in volume indicates that SHIB might be getting ready for a reversal. Increasing volume at a support level frequently indicates the accumulation of buying pressure which is a sign of bullish momentum. Should this buying strength persist SHIB might try to push toward the resistance level of $0.00001280. A break above that level might lead to the 50-day moving average which is located close to $0.00001320.
Nearing oversold territory the RSI (Relative Strength Index) is presently trading at about 35. An immediate bullish reversal is further supported by this technical condition because historically SHIB tends to recover when the RSI falls below 40. SHIB though needs to act swiftly. A confidence breakdown could result from the price moving toward psychological levels around $0.000010 or lower if the $0.000011 support is not held, potentially adding the dreaded extra zero.
Bitcoin's turn
After a week of intense volatility, Bitcoin has reached a critical turning point. After a severe correction that sent the price plummeting from over $85,000 to as low as $77,000 the biggest cryptocurrency in the world is now scrambling to recover and hold the psychologically crucial $80,000 threshold. Selling pressure was sparked by the recent market turbulence which was caused by risk-off sentiment sparked by global macroeconomic factors and included growing geopolitical tensions and tariff concerns.

A breakdown below Bitcoin's 200-day moving average as a result of this selloff exacerbated bearish sentiment and drove the RSI closer to oversold levels. A notable increase in volume however suggested that buyers were feeling confident as Bitcoin swiftly recovered from the $77,000 area. With Bitcoin managing to stabilize between $79,000 and $80,000 this recovery has rekindled market optimism.
There is more to the fight for $80,000 than meets the eye. It's a crucial support level that might enable Bitcoin to restore its bullish structure if it is reclaimed and maintained. Near $83,500 and $85,000 which were levels of support during Bitcoin's consolidation earlier this year are immediate resistance. The good news is that the quick recovery indicates that there is a high level of demand below $80,000. Unfortunately despite that recovery Bitcoin closed below this crucial level which may encourage more short-term selling if momentum stalls.
 Dan Burgin
 U.Today Editorial Team