
Disclaimer: The opinions expressed by our writers are their own and do not represent the views of U.Today. The financial and market information provided on U.Today is intended for informational purposes only. U.Today is not liable for any financial losses incurred while trading cryptocurrencies. Conduct your own research by contacting financial experts before making any investment decisions. We believe that all content is accurate as of the date of publication, but certain offers mentioned may no longer be available.
Stellar (XLM) has completed a death cross on its daily charts, its first major bearish signal of the year. The bearish technical formation comes on the heels of a significant drop in XLM’s price, fueling speculation of deeper downside risk.
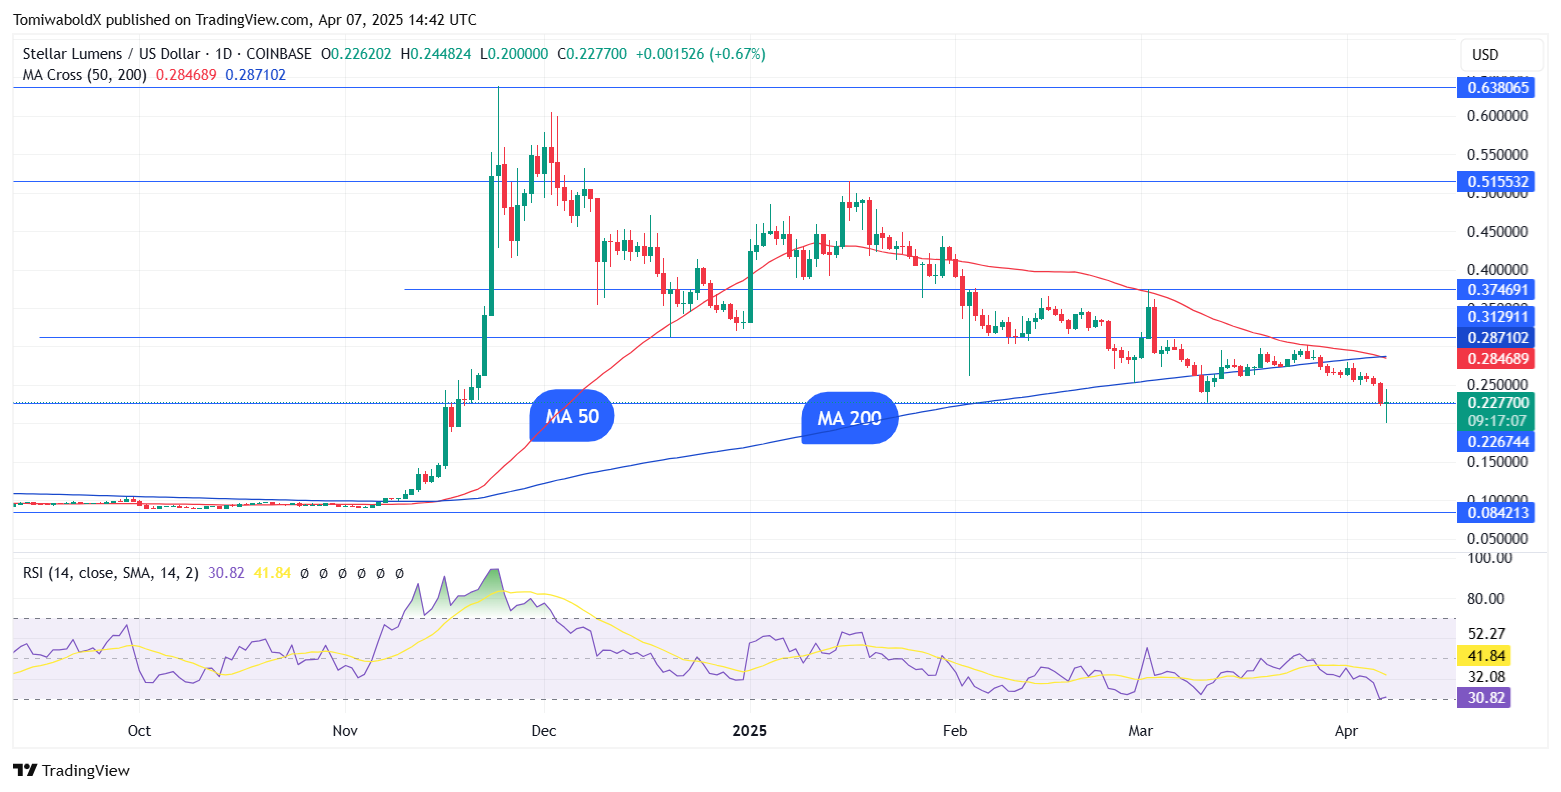
The death cross, which occurs when the 50-day moving average crosses below the 200-day moving average, is one of the most closely observed technical indications on the market. Traditionally seen as a negative indication, its appearance often signals the beginning of a potential downward trend. The 50-day SMA has crossed below the 200-day SMA on Stellar's chart, indicating a death cross.
For Stellar, this is the first time such a crossover has occurred since mid-2024, raising concerns that the recent decline might be more than just a short-term pullback.

At press time, XLM was down 6.33% in the last 24 hours to $0.23 and down 16% weekly amid an extended market sell-off.
The market dip worsened in Monday's session, with major crypto assets, including Bitcoin, Ethereum, XRP, Solana and Stellar all experiencing significant declines. Weak market sentiment, rising liquidations and uncertainty around macroeconomic conditions have all contributed to the downturn.
What comes next?
While death crosses may indicate a probable downward trend, they do not guarantee protracted bear markets. However, they do serve as warning signs, especially when accompanied by price weakness and declining momentum.
XLM rebounded from lows of $0.20 in today's session, reaching $0.239 at press time. The RSI has sharply rebounded from oversold areas, highlighting the possibility of a relief rally in the short term. If the rebound is sustained, XLM would aim for a breach of its daily moving averages of 50 and 200 at $0.284 and $0.287, respectively. If successful, XLM would target $0.375 and $0.443 next.
On the other hand, if XLM's price turns down from its moving averages, it might retest support at $0.20. Meanwhile, major declines might aim for support at $0.10.
 Dan Burgin
 U.Today Editorial Team