
Bitcoin continues making waves, and its recent fluctuations have caused a lot of discussions around BTC’s future price. Experts from TradingView have found there’s a trend change coming soon. Here’s what they think about Bitcoin’s short-term performance.
Longs/Shorts Changes Signal Trend Shifting
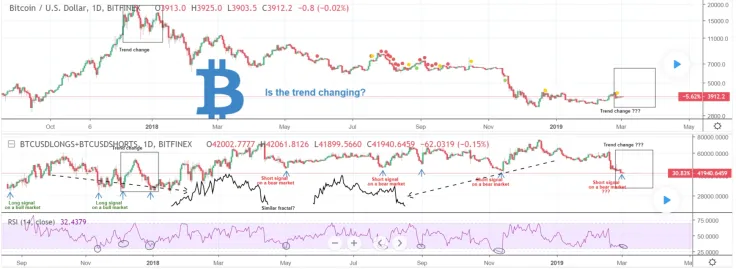
Bitcoin price chart from InvestingScope
InvestingScope took a closer look at the Longs/Shorts speculation. During the bearish market, the overselling of RSI signaled Sell. During bull markets, it signaled Buy. Thus, every time that RSI is oversold on the Longs/Shorts, the price action should be taken because it precedes a long term trend.
So, what is the upcoming trend about?
In their Longs/Shorts research, InvestingScope has identified the sequence that predicts a trend change. Here’s what they write: “The fractals before the trend changed last time from bullish to bearish, appears to be similar to the current sequence. Will this lead to a trend change? If the sequence continues to print the same candles it just might.”
Hopefully, the trend will change to a positive side, and we will witness BTC reaching $4,000 this month.
BTC is approaching support
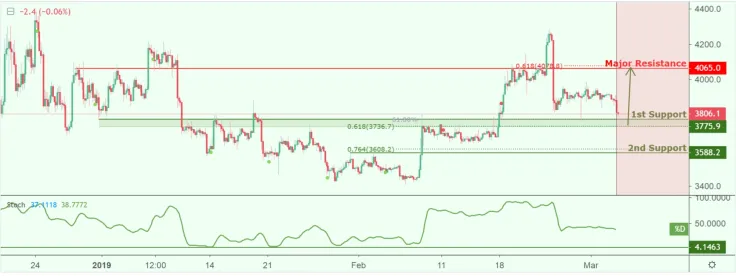
Bitcoin price chart from easyMarkets
According to easyMarkets, BTC/USD is about to reach the support zone at 3,775.9 with 61.8% Fibonacci retracement. It means a serious bounce can occur, pushing the BTC price to the 4,065.0 resistance level. Stochastic factor (89,5,3) is also approaching support – there’s a corresponding price growth. However, trading CFDs on margin is connected to high risks, and your losses can exceed the initial investments.
Potential breakout is coming
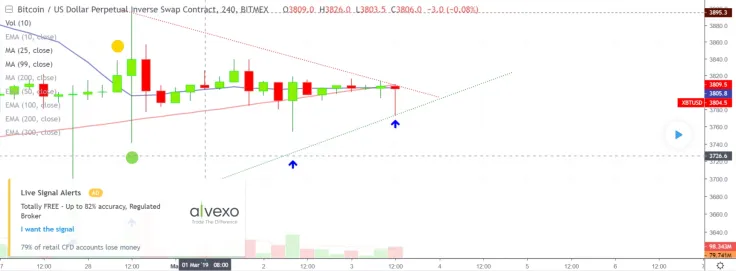
Bitcoin price chart from alanmasters
In the 4H time frame, Bitcoin has hit the higher lows and now is staying at MA25 with MA99 being immediate resistance. According to alanmasters, if XBTUSD can break MA99 with decent volume, we should witness a $3,900-$4,000 move in the short term. Yet, if BTC gets below MA25 ($3,805), the last low will be tested. There’s another rejecting of sellers, which can lead to breakout if bulls follow.
It’s better to wait before you buy
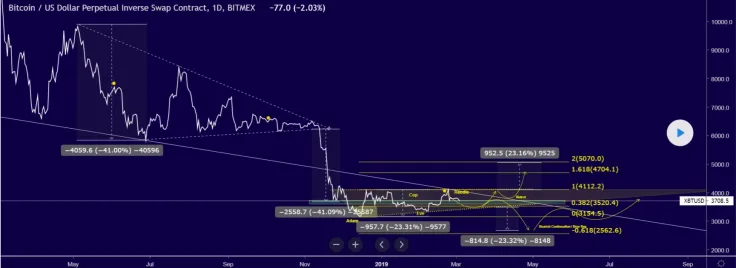
Bitcoin price chart from TheTrex
A user called TheTrex recently posted that BTC formed an Adam and Eve pattern, and it showed what the target would be if the formation breaks up. Last time the price went through a rejection, traders hoped that BTC would form a cup on this Eve and the target zone to buy a few coins. With stop loss below 3,750, the loss would be minimal while BTC is trading near 3,700.
“My thoughts are that bitcoin has two structural targets, if indeed the handle fails, which would happen below 3400 we are looking at bearish continuation with targets of 3350/3150/2675/2565.
If Bitcoin continues to be bullish and re-establishes support we should see a consequent retest of 4100 then most likely a retest of 3800 and further up continuation towards 4700/5100.”
Thus, you can try to buy some BTC, but its tendencies aren’t absolutely defined yet.
BTC/USD price chart on TradingView
Disclaimer: The opinion expressed here is not investment advice – it is provided for informational purposes only. It does not necessarily reflect the opinion of U.Today. Every investment and all trading involves risk, so you should always perform your own research prior to making decisions. We do not recommend investing money you cannot afford to lose.
 Alex Dovbnya
 Gamza Khanzadaev
 Tomiwabold Olajide
 Denys Serhiichuk
 Godfrey Benjamin