Disclaimer: The opinions expressed by our writers are their own and do not represent the views of U.Today. The financial and market information provided on U.Today is intended for informational purposes only. U.Today is not liable for any financial losses incurred while trading cryptocurrencies. Conduct your own research by contacting financial experts before making any investment decisions. We believe that all content is accurate as of the date of publication, but certain offers mentioned may no longer be available.
Crypto analyst Ali has hinted at a potential direction for Litecoin's (LTC) price based on its MVRV (Market Value to Realized Value) ratio. He observes that the 30-day MVRV for Litecoin is about 35% and that every time LTC has exceeded the 30% level since 2018, a sharp price correction follows. Consequently, LTC suffers a price drop ranging from 30% to 40%.
Currently, #Litecoin MVRV 30D hovers around 35%.
— Ali (@ali_charts) July 2, 2023
Historically, each time $LTC MVRV 30D exceeds the 30% mark since 2018, a sharp price correction typically follows! This usually translates to a #LTC price drop ranging from 30% to 40%. pic.twitter.com/R5oMMaKWGc
"Currently, Litecoin MVRV 30D hovers around 35%. Historically, each time LTC MVRV 30D exceeds the 30% mark since 2018, a sharp price correction typically follows. This usually translates to a LTC price drop ranging from 30% to 40%," Ali tweeted.
Over the weekend, on-chain analytics firm Santiment warned of a local top formation for LTC as social volume rose.
According to Santiment, LTC social volume spikes frequently result in a temporary top.
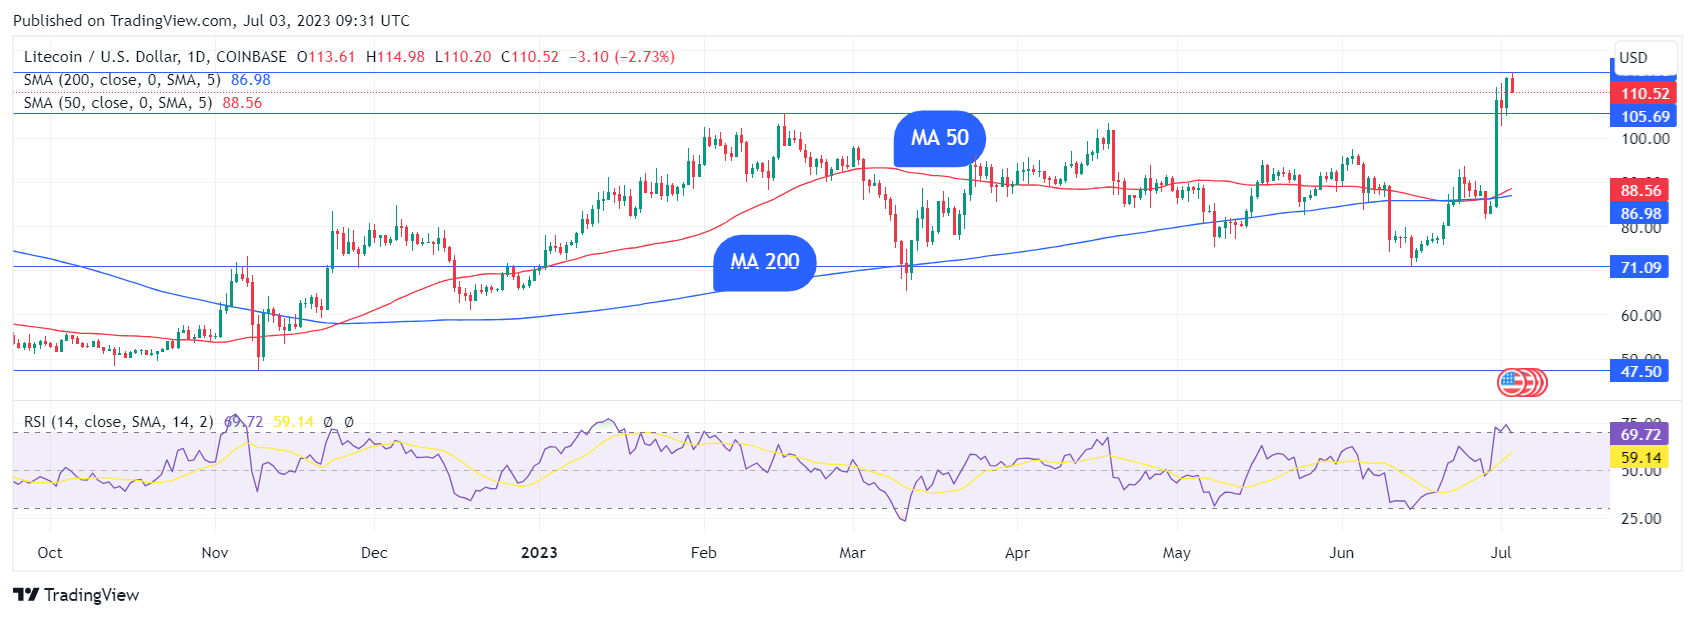
On June 30, the price of LTC skyrocketed as it printed a massive green candlestick. The surge continued, reaching highs of $114.98 at the time of writing. The token is up nearly 27% in the last seven days.
Litecoin is presently trading at $110, up a little in the last 24 hours. The daily RSI is currently above the 70 overbought levels, suggesting that bulls may take a little breather before continuing the rise.
Litecoin forms golden cross
Litecoin has formed a golden cross, as shown on the daily chart. A golden cross occurs when the moving average (MA) 50 rises above the daily moving average (MA) 200 and is commonly seen as a positive indication.

Because moving averages are backward-looking indicators, the signal indicates that the market's short-term gains have outpaced its long-term gains. Nonetheless, chart experts and traders regard it as a sign of rising prices in the long run.
The forthcoming halving event in August is regarded as a bullish stimulus for the Litecoin price. Each Litecoin halving was preceded by a significant price increase, implying that a similar scenario might be probable if history repeats itself.


 Caroline Amosun
 Arman Shirinyan
 Godfrey Benjamin
 Yuri Molchan
 Tomiwabold Olajide