
Disclaimer: The opinions expressed by our writers are their own and do not represent the views of U.Today. The financial and market information provided on U.Today is intended for informational purposes only. U.Today is not liable for any financial losses incurred while trading cryptocurrencies. Conduct your own research by contacting financial experts before making any investment decisions. We believe that all content is accurate as of the date of publication, but certain offers mentioned may no longer be available.
Veteran trader Peter Brandt has once again captured the attention of the cryptocurrency community, this time with his analysis of Ethereum's chart, which he describes as "very intriguing."
Brandt, known for his insightful analysis and decades of experience in financial markets, shared his perspective on Ethereum's price action, sparking discussion among traders and investors.
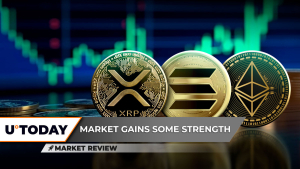
Ethereum, the second-largest cryptocurrency by market value, has been showing some interesting activity on the charts, capturing the attention of analysts such as Brandt.
Brandt's analysis comes at a crucial time for Ethereum, as the cryptocurrency market navigates a period of volatility and uncertainty. Bitcoin, the first and largest cryptocurrency by market capitalization, fell to intraday lows of $60,601, following three days of losses.

 Mushumir Butt
Ethereum also mirrored BTC's price action, falling for three days to a low of $2,937 on May 8. At the time of writing, Ethereum was trading below $3,000, down 1.05% in the last 24 hours to $2,972.
In his analysis, Brandt considers two chart patterns to assess Ethereum's potential trajectory. Unable to completely settle for any of these two patterns, Brandt characterizes Ethereum's chart as "very intriguing."
In one case, Brandt considered that the pattern he highlighted on the ETH price chart resembled a flag: a continuation pattern that often appears during a brief pause in either a bullish or bearish trend.
He contends that due to its length, the pattern might not be considered a flag, but a channel seems the most likely label. A channel forms when price action is controlled by two parallel, sloping lines and the price has tested each of these lines at least twice. A flag might appear as a small channel after a steep trend, which develops in the opposite direction.

 Tomiwabold Olajide
Ethereum's chart, according to Brandt, warrants careful consideration and analysis given the uncertainty of the next price movements. Whether a flag or a channel, both have the potential of a breakout in both directions either up or down. "I could go either way with this chart," Brandt explained.