Disclaimer: The opinions expressed by our writers are their own and do not represent the views of U.Today. The financial and market information provided on U.Today is intended for informational purposes only. U.Today is not liable for any financial losses incurred while trading cryptocurrencies. Conduct your own research by contacting financial experts before making any investment decisions. We believe that all content is accurate as of the date of publication, but certain offers mentioned may no longer be available.
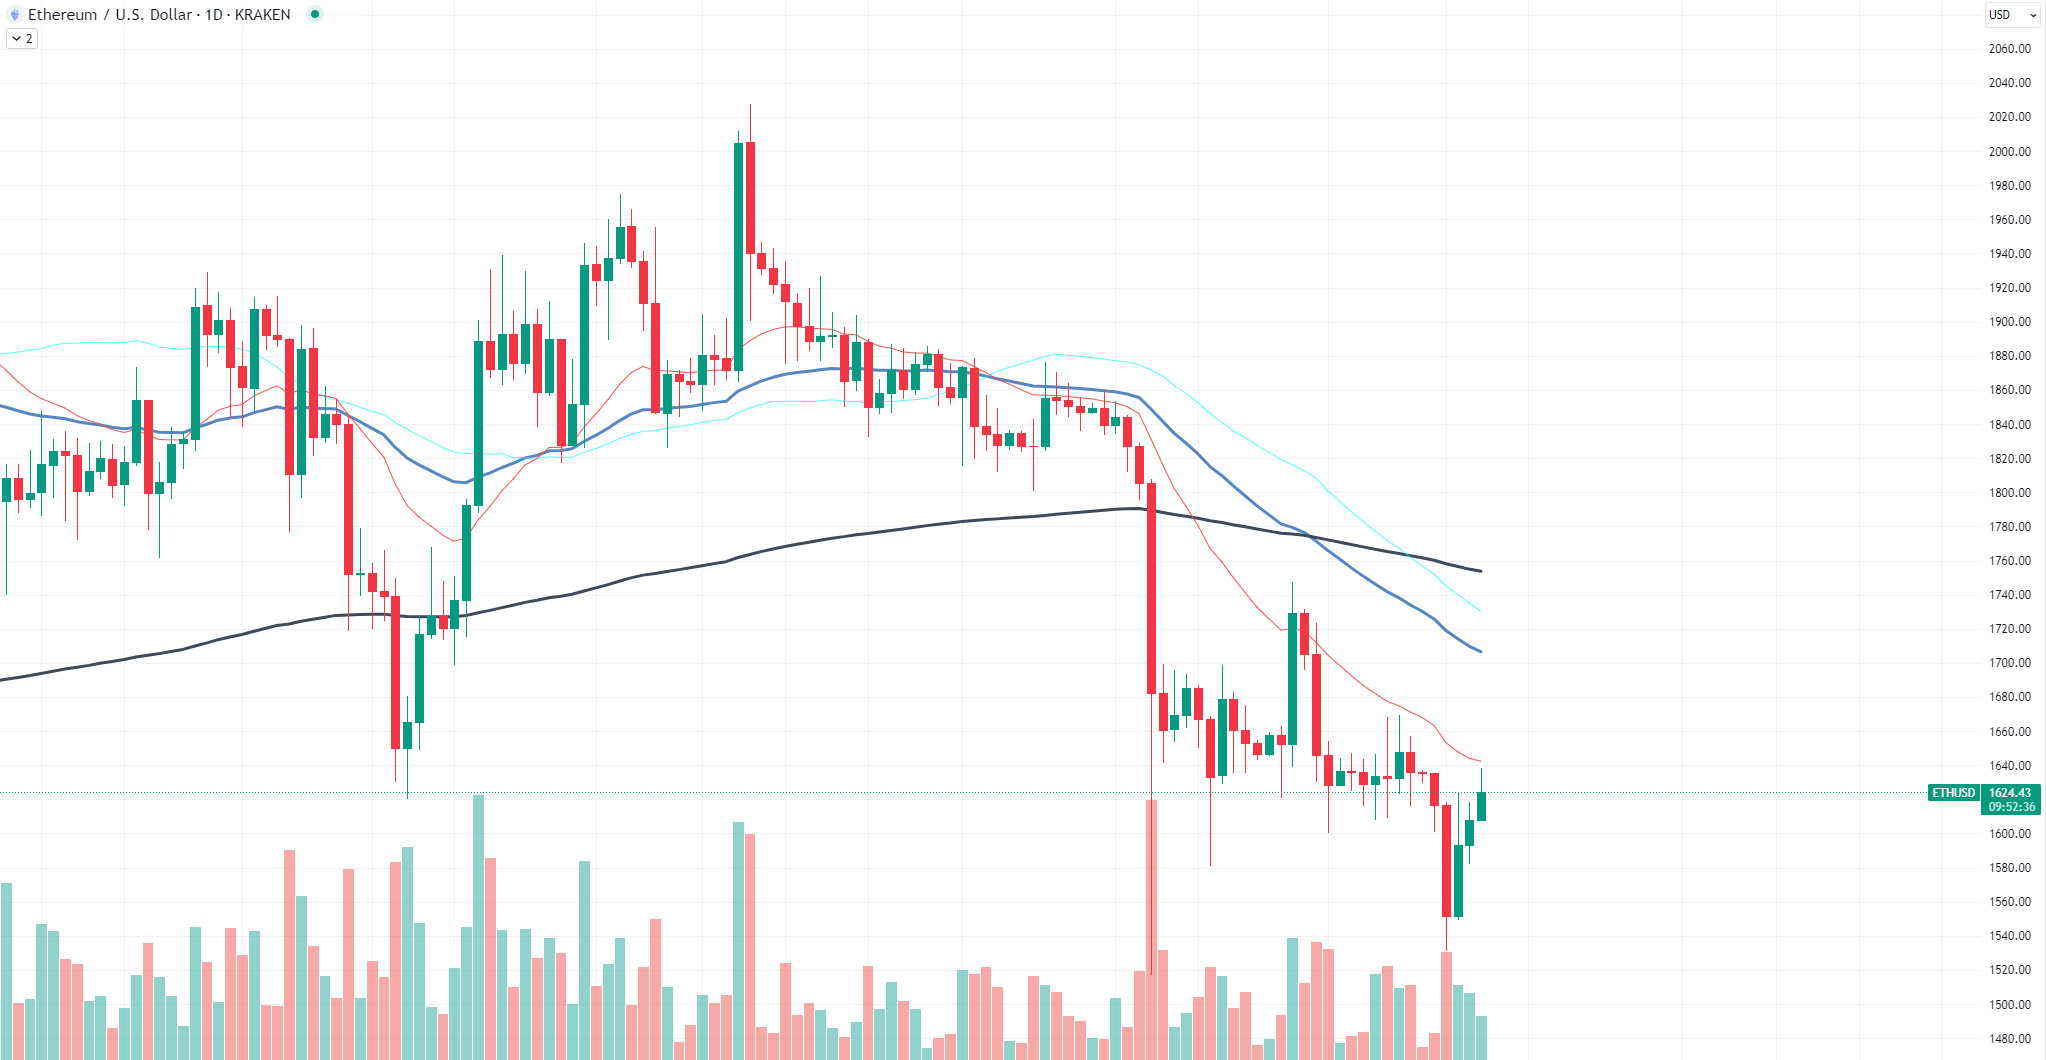
Ethereum's journey skyward has hit a speed bump, and it is called the 21 EMA (Exponential Moving Average). This resistance level has long been anticipated as the first real test for the second-largest cryptocurrency. Yet, Ethereum has not managed to break through, stalling its upward momentum.
As of the latest data, Ethereum is trading at around $1,618.43. The 21 EMA has proven to be a formidable barrier, acting as the ceiling that Ethereum needs to crack to sustain its climb. It is like a glass ceiling, visible but tough to shatter. This resistance level is crucial because it often serves as a litmus test for investor sentiment and future price action.

But there is another twist in the tale. Ethereum, once celebrated for its deflationary mechanism, is no longer enjoying that status. Why? Well, network activity has dipped to extremely low levels. The buzz and hustle that usually surround Ethereum have quieted down, affecting its deflationary nature. This low activity could be a contributing factor to Ethereum's struggle with the 21 EMA resistance.
What's next for Ethereum? The 21 EMA remains the key focus. Breaking it could open the door to a more bullish scenario, while failure to do so might signal a bearish trend. Either way, the coming days are pivotal for Ethereum, especially as it tries to regain its deflationary status amid low network activity.
Solana battle narratives
Solana's recent market narrative might have you thinking it is all doom and gloom. But if you dig a bit deeper, you will find that the situation is not as dire as it seems. In fact, some savvy whales seem to be playing a different game altogether.
As of the latest data, Solana (SOL) is trading at approximately $18.6. While this might not scream "bull market," it is essential to look beyond the surface. The trading volume and open interest in Solana have seen a noticeable uptick. These are classic indicators of accumulation, suggesting that some big players are quietly buying up SOL.
Why the sudden interest? Well, the recent fear, uncertainty and doubt (FUD) surrounding Solana might not be as grounded in reality as some would have you believe. Whales, who often have access to better information and analytics, seem to understand this. They appear to be taking advantage of the situation, buying the dip while everyone else is selling.
The surge in trading volume and open interest is a telltale sign that funds are moving in the background. These metrics often precede price movement, and in this case, they are pointing upward. It is as if the market is whispering, "Hey, pay attention; something's about to happen here."
But here's the kicker: Solana is no longer just the flavor of the month; it is becoming a staple in diversified crypto portfolios. While the broader market continues its roller coaster ride, Solana's underlying fundamentals remain strong.
Cardano reaches pivotal point
Cardano (ADA) is navigating choppy waters, and the signs are all there. The crypto asset has been on a rapid descent, lingering below the 21 EMA — a classic indicator of a strong downtrend. As of today, ADA is trading at $0.2471, and the trend does not look promising.
But here's the twist: trading volume is dwindling. Generally, a decrease in volume during a downtrend could signal a potential reversal or at least a pause in downward momentum. It is like the market is holding its breath, waiting for the next big move.
Adding another layer to this complex picture is the Relative Strength Index (RSI). On Sept. 11, the RSI for ADA bottomed out. When the RSI hits rock bottom, it often indicates that the asset is oversold and could be due for a rebound. But remember, RSI is just one piece of the puzzle; it is not a crystal ball.
What's the takeaway? Cardano is at a pivotal point. The declining volume and bottomed-out RSI could be the market's subtle hint toward a potential turnaround. But for now, the 21 EMA remains a formidable barrier that ADA has yet to conquer.


 Vladislav Sopov
 Dan Burgin