Disclaimer: The opinions expressed by our writers are their own and do not represent the views of U.Today. The financial and market information provided on U.Today is intended for informational purposes only. U.Today is not liable for any financial losses incurred while trading cryptocurrencies. Conduct your own research by contacting financial experts before making any investment decisions. We believe that all content is accurate as of the date of publication, but certain offers mentioned may no longer be available.
Ethereum has stood out not just as a platform but also as an asset with considerable price dynamics. Analyzing the Ethereum/USDT daily chart from Kraken, there is a pattern brewing that may provide a silver lining for ETH enthusiasts: the potential formation of a "higher low" pattern.
The "higher low" pattern, for those uninitiated, is a technical indicator often signaling a bullish reversal in the asset's price direction. It occurs when the price of an asset forms a low that is higher than the previous prominent low, which is precisely what seems to be emerging in Ethereum's case. If this pattern solidifies, it could be a strong hint at the underlying strength of Ethereum's price movement and its resilience against broader market downturns.
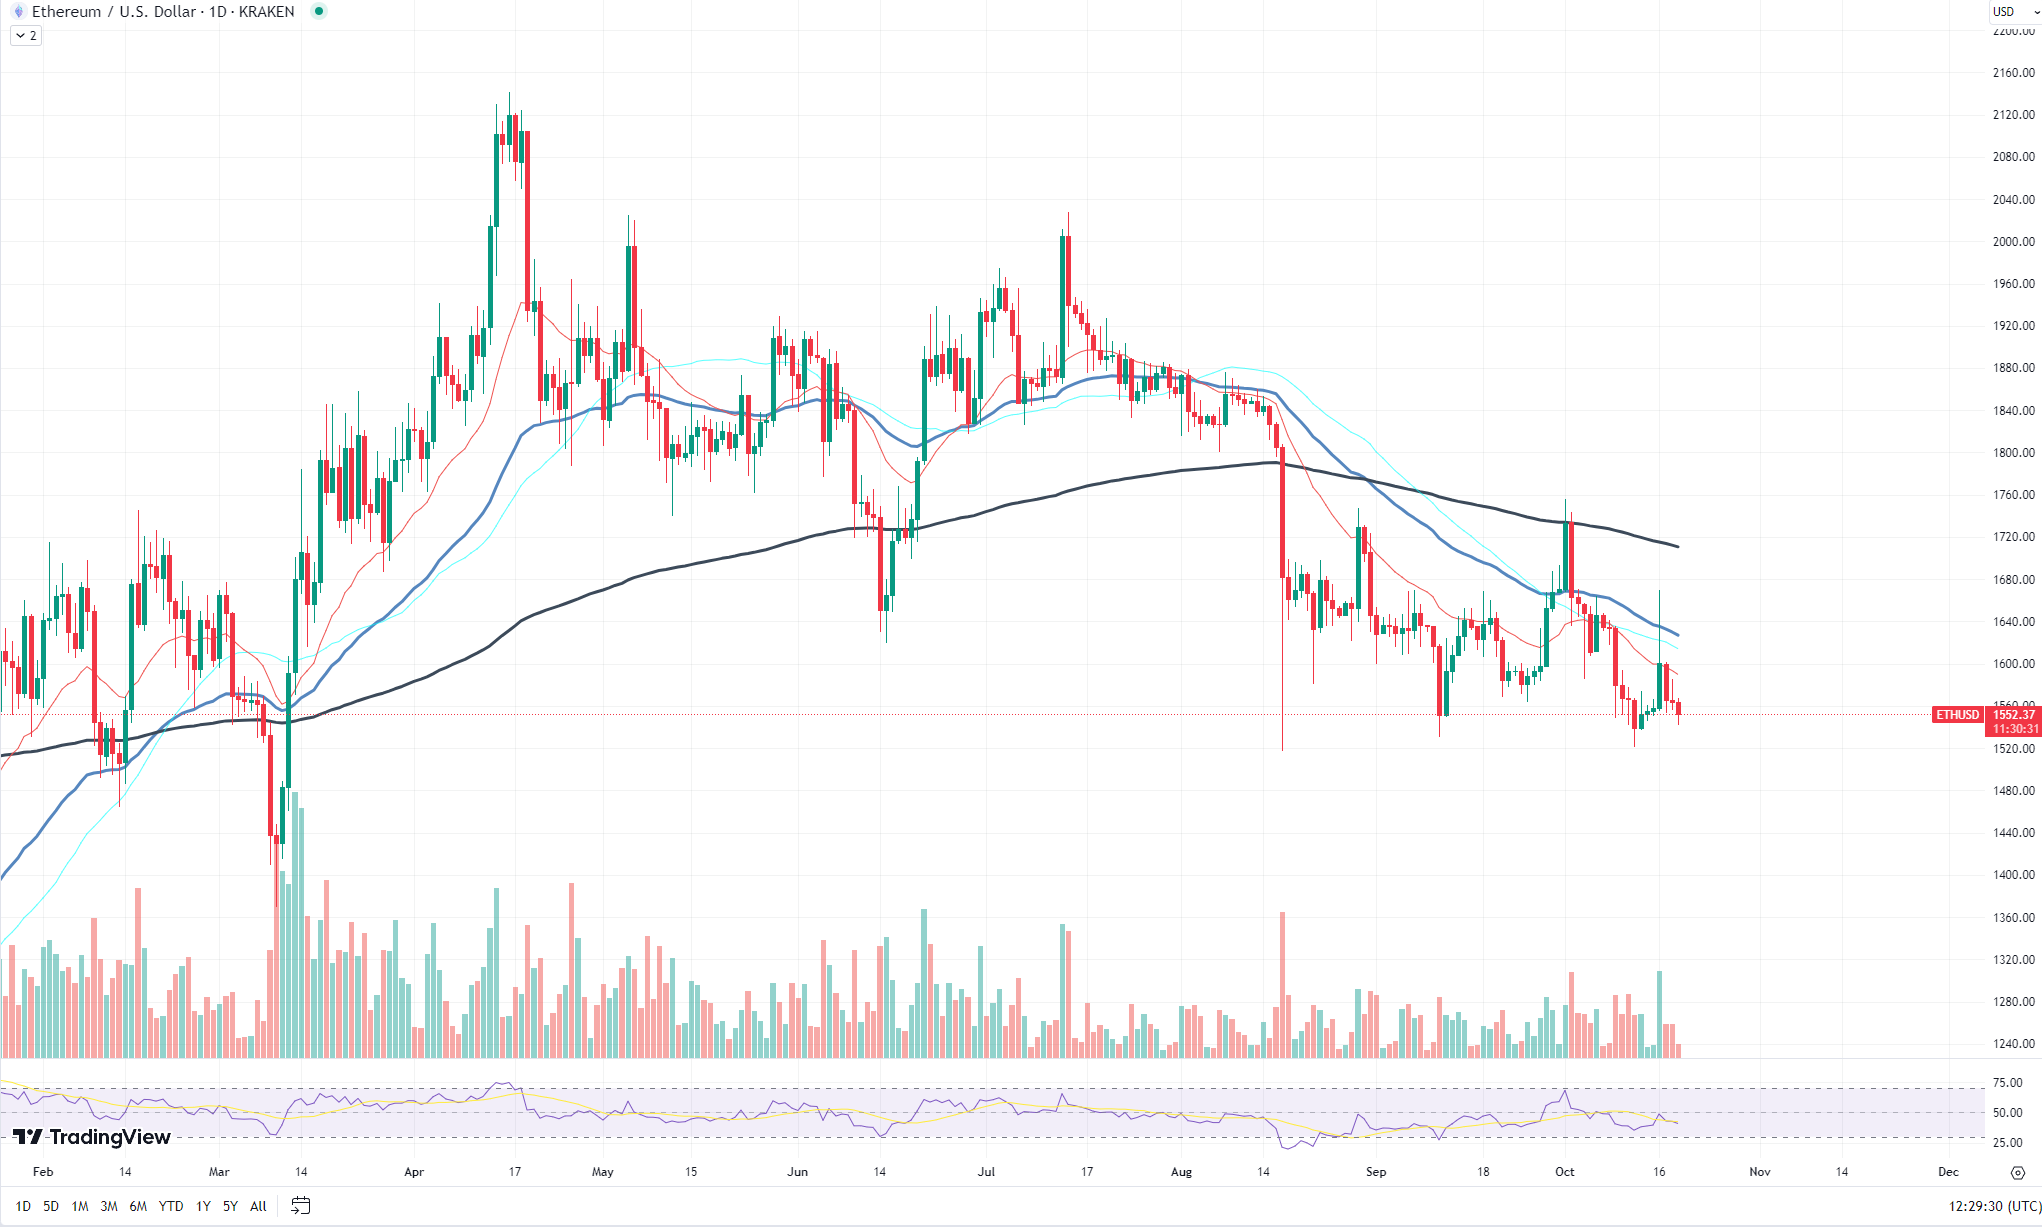
Adding fuel to this optimistic analysis is the rising trading volume accompanying Ethereum's recent price action. Typically, an increase in trading volume is seen as a confirmation of a prevailing price trend. When associated with potential bullish patterns, such as the "higher low," a surge in trading volume can indicate strong buying interest and reduced selling pressure.
While it is always crucial to approach market predictions with a grain of salt, the current scenario paints an interesting picture for Ethereum. The potential formation of a "higher low" pattern, combined with the bolstering trading volume, makes a compelling case for a possible price reversal. Investors and traders alike might want to keep a close watch on Ethereum's next moves.
XRP's support remains unbreached
The XRP market, like many others in the crypto space, undergoes periods of volatility and consolidation, and an understanding of its technical outlook is vital for any discerning investor. One critical observation from the XRP/USDT daily chart from Binance is the underlying strength of the fundamental support level, hovering around the $0.47 mark. This value, despite the currency's recent fluctuations, has remained resilient, suggesting its significance as a potential rebound point.

First, let's address the elephant in the room — the "death cross." A death cross, a technical chart pattern signaling the potential for a major sell-off, is typically observed when the short-term moving average crosses below its long-term counterpart. However, in XRP's case, its relevance is debatable. The asset's current trajectory and the broader market conditions do not necessarily resonate with the historically bearish implications of this pattern. It is essential to consider the broader picture and not get fixated on singular chart patterns, especially when they contradict other indicators.
Speaking of indicators, the descending trading volume accompanying XRP's price movement is worth noting. Traditionally, a decrease in volume during a downtrend might suggest a weakening of selling pressure. When analyzed alongside the steadfast $0.47 support level, this paints an intriguing picture. The subdued trading volume could indicate a possible exhaustion of bearish momentum, hinting at a potential trend reversal or, at the very least, a consolidation phase.
Cardano getting ready
Cardano (ADA), one of the foremost players in the crypto sphere, appears to be constructing a sturdy base for a potential trend reversal, per its daily chart against Tether (USDT) on Binance. The chart paints an intriguing picture for ADA, suggesting that a strategic play is in the works.

First and foremost, there is a noticeable support level that ADA seems to be clinging to. This support level is not just a random point on the chart but carries historical significance. It was around this same price level in December where Cardano demonstrated resilience and staged a remarkable comeback. This price point has proven its mettle as a strong foundation, and ADA's current adherence to it may hint at a potential repeat of history.
In addition to the evident support, another captivating element in the chart is the squeeze taking place between this support level and the 50-day Exponential Moving Average (EMA). The 50 EMA has often been used by traders and analysts alike as a gauge for medium-term price direction. A squeeze like this typically indicates a tussle between the bulls and the bears, leading to an eventual breakout in one direction.
 Dan Burgin
 U.Today Editorial Team