While Ethereum is keeping steady at around $170, traders start making plans on how to profit from its price fluctuations. Want to join the rows of ETH traders? Read ETH price predictions from TradingView to find out when is the right time to buy and sell, and how high ETH will grow.
Big move is coming

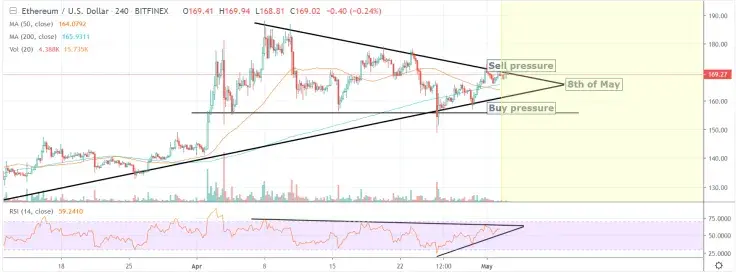
Looking at both the price and RSI graphs, we can conclude that Ethereum is aiming for an uptrend. However, there’s something happening to the market that influences Ethereum’s price. If you look at the Bitfinex news, and the exchange rate of USDT/USD, which is actually trading at around 1.05, you can conclude that Ethereum’s current price is not $169 but actually $169/1.05 dollars.
BFCMInvest believes that Bitfinex and Tether will solve the issue and the USDT/USD rate will come back to 1.00, but it's probable that right now it will ramp up to 1.07/1.08. This means that the price of Ethereum on Bitfinex is expected to go up 3% only because of Tether’s price.
Now let’s take a look at the price graph: we have a dynamic support that comes from the start of March, and the dynamic resistance that is valid since the start of April. It means we will see a breakout in one direction. From the technical side, we should bet on the upper break, but from the fundamental analysis standpoint, it's more likely to break on the downwards.
Buy at $158, sell at $190

So how to trade Ethereum? Trader druumabb will explain it to us.
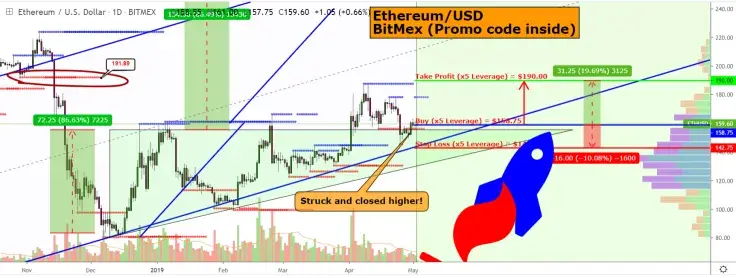
Last time when traders used stop loss, the amount of investment was increased by x2. There was a false breakdown and now a new top will be updated.
It has struck and closed higher on Daily chart.
Buy = $158.75
Take Profit = $190.00
Stop Loss = $142.75
Take Profit (x5 Leverage) = +98.45%
Stop Loss (x5 Leverage) = -50.40%
Ethereum will reach $190 somewhere by the middle of May.
Drop is inevitable?

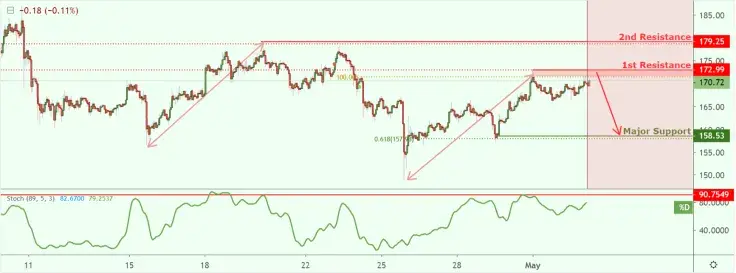
ETH/USD is testing our first resistance at $172.99 (horizontal swing high resistance, 100% Fibonacci extension, 61.8% Fibonacci retracement) where we might see a corresponding drop in price to our major support level at $158.53 (horizontal swing low support, 61.8% Fibonacci retracement).
Stochastic is also approaching resistance where we might see a corresponding drop in price. Trading CFDs on margin carries a high risk, so do not enter this kind of trade if you’re unsure about your possibilities and budget.
Double bottom or bear flag?

The market is at a turning point for Ethereum, and now it seems like it’s going to keep this one short.
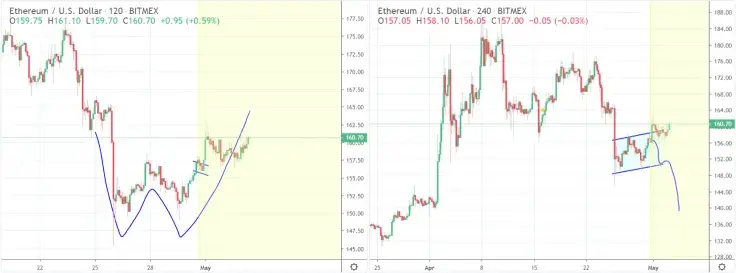
According to botje11, we have 2 options here: it's either a bear flag or a double bottom. For the double bottom, we need to see it move inside of a small bull flag as we can see on the left. So it needs to stay close against the neckline of the W bottom for a while, maybe a few hours. If that happens, a break upwards is very likely to happen.
If we see rejection at the current level and drop again below $155 then the bear flag option will become much more likely to happen.
It’s hard to say for sure what exactly will occur. For the bullish scenario, we should play it safe and wait a while to see that small bull flag play out first. Because then your chances go from 50/50 to almost 80/90%. For the bears, it’s more difficult, because if it starts to drop it will likely continue to drop.
The user himself prefers the bullish outcome, but only if BTC can hold current levels. The prediction would be much easier if we didn't have that Finex issue hanging over the market. But feels like most already forgot about it. Tether is also on its way up again, which is good.
The bull flag played out perfectly, going sideways for a few hours around the resistance and as mentioned, increasing the chances a lot when showing some patience and having the odds in your favor. In the short term, we could see a test of the neckline again, we should NOT drop below that neckline anymore around 156!

 Caroline Amosun
 Tomiwabold Olajide