
Disclaimer: The opinions expressed by our writers are their own and do not represent the views of U.Today. The financial and market information provided on U.Today is intended for informational purposes only. U.Today is not liable for any financial losses incurred while trading cryptocurrencies. Conduct your own research by contacting financial experts before making any investment decisions. We believe that all content is accurate as of the date of publication, but certain offers mentioned may no longer be available.
Ethereum traders are spotting what might be a harbinger of stormy weather ahead. A technical analysis of the ETH chart reveals the potential formation of a double top pattern, a classic bearish reversal indicator that could send Ethereum's price diving deep once more.
The double top pattern is characterized by two consecutive peaks at approximately the same price level, separated by a moderate trough. This pattern suggests that the bullish momentum is waning, and the bears may be ready to take control. For Ethereum, the stakes are high as it approaches a critical resistance level set on Jan. 12. The ability to break through this ceiling is paramount for ETH to maintain its upward trajectory.
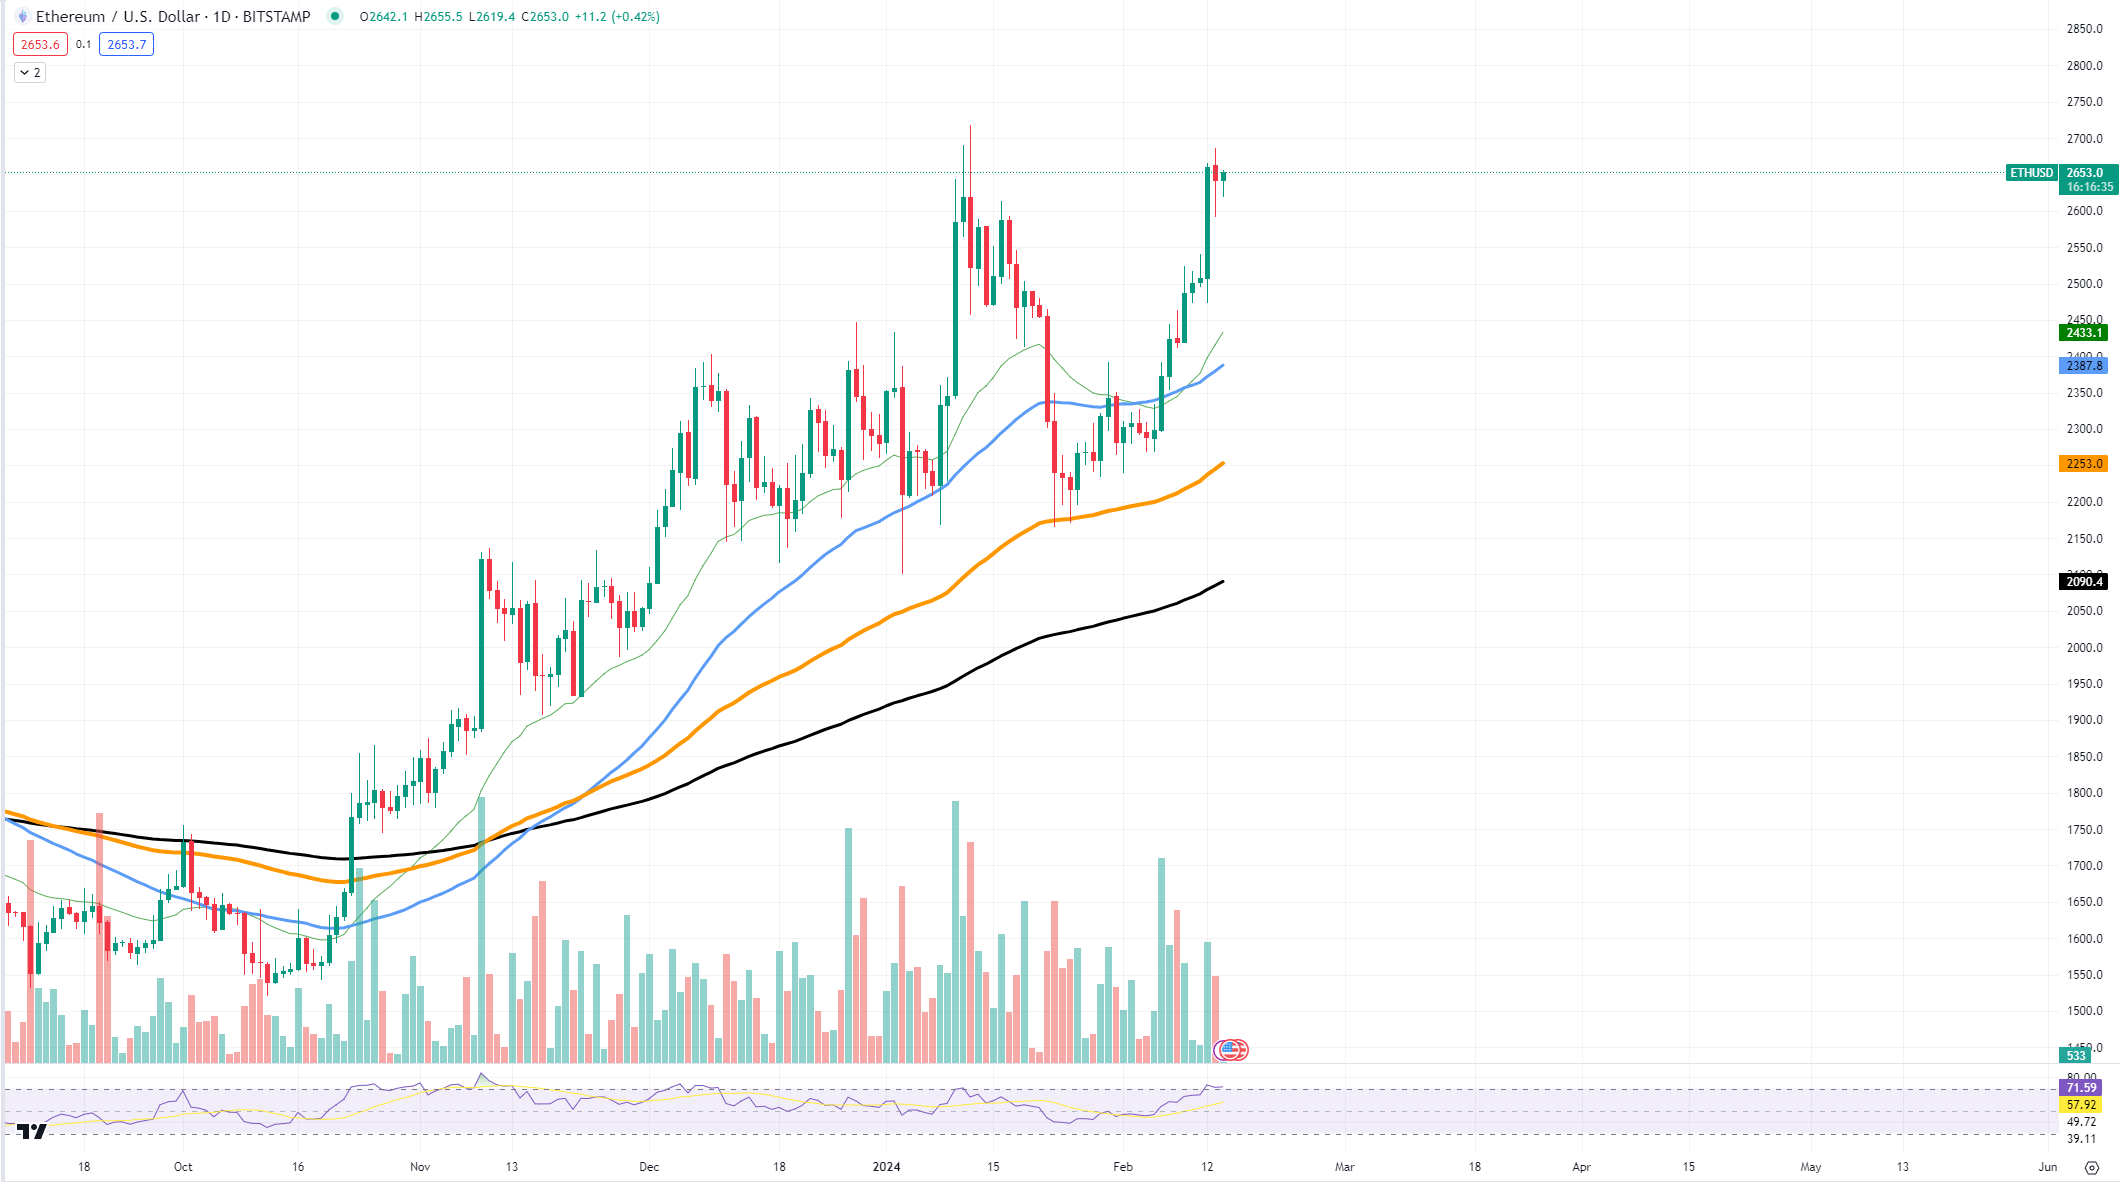
As Ethereum approaches this pivotal point, the descending volume accompanying the recent price increases adds to the sense of impending reversal. In technical analysis, a rise in price coupled with falling volume can often signal a lack of conviction among buyers, suggesting that the rally may not be sustainable.
If the market cannot muster the volume needed to push past the January resistance, the likelihood of confirming the double top pattern increases significantly.

Should Ethereum fail to breach the Jan. 12 resistance, the asset may retreat to the next substantial threshold at $2,500. This price level represents a psychological and technical support zone that has previously acted as both a springboard for rallies and a cushion during corrections. A fall to this level would be a significant retracement from recent highs, and it could trigger further bearish sentiment on the market.
The current chart pattern and volume indicators serve as a warning. While the double top has yet to be confirmed, the signs are there, and caution is advised. A breakout above the resistance will invalidate the bearish outlook, or a confirmation of the double top with a break below the trough between the peaks.
 Dan Burgin