
Disclaimer: The opinions expressed by our writers are their own and do not represent the views of U.Today. The financial and market information provided on U.Today is intended for informational purposes only. U.Today is not liable for any financial losses incurred while trading cryptocurrencies. Conduct your own research by contacting financial experts before making any investment decisions. We believe that all content is accurate as of the date of publication, but certain offers mentioned may no longer be available.
The new year has started with a cryptocurrency market correction, with all coins from the top 10 list being in the red zone.
BTC/USD
The price of Bitcoin (BTC) has gone down by 2.24% over the last 24 hours.
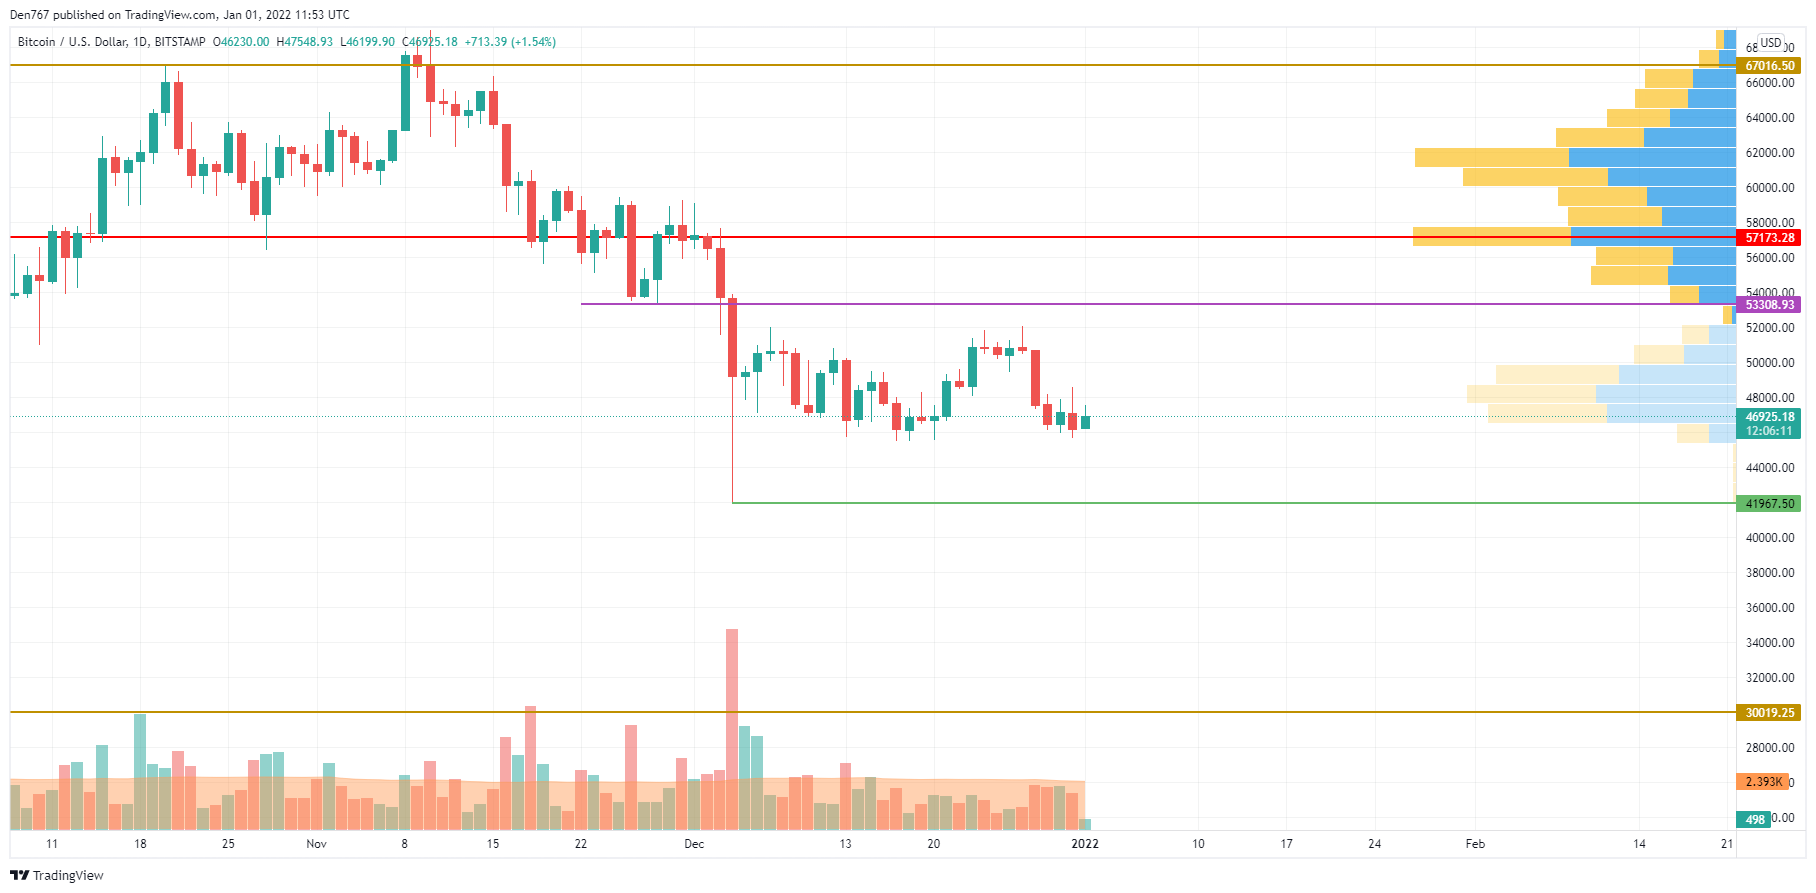
Despite the dip, the chief crypto is located in the middle of a wide channel between the support level at $41,967 and the resistance level at $53,300. In this case, one needs to wait until the price comes back to the green line and finds footing below it.
If that happens, bears might completely seize the opportunity to push the price of BTC down to the vital level of $40,000.
Bitcoin is trading at $46,934 at press time.
XRP/USD
XRP is flat-lining today, with its price going down by a mere 1% since yesterday.
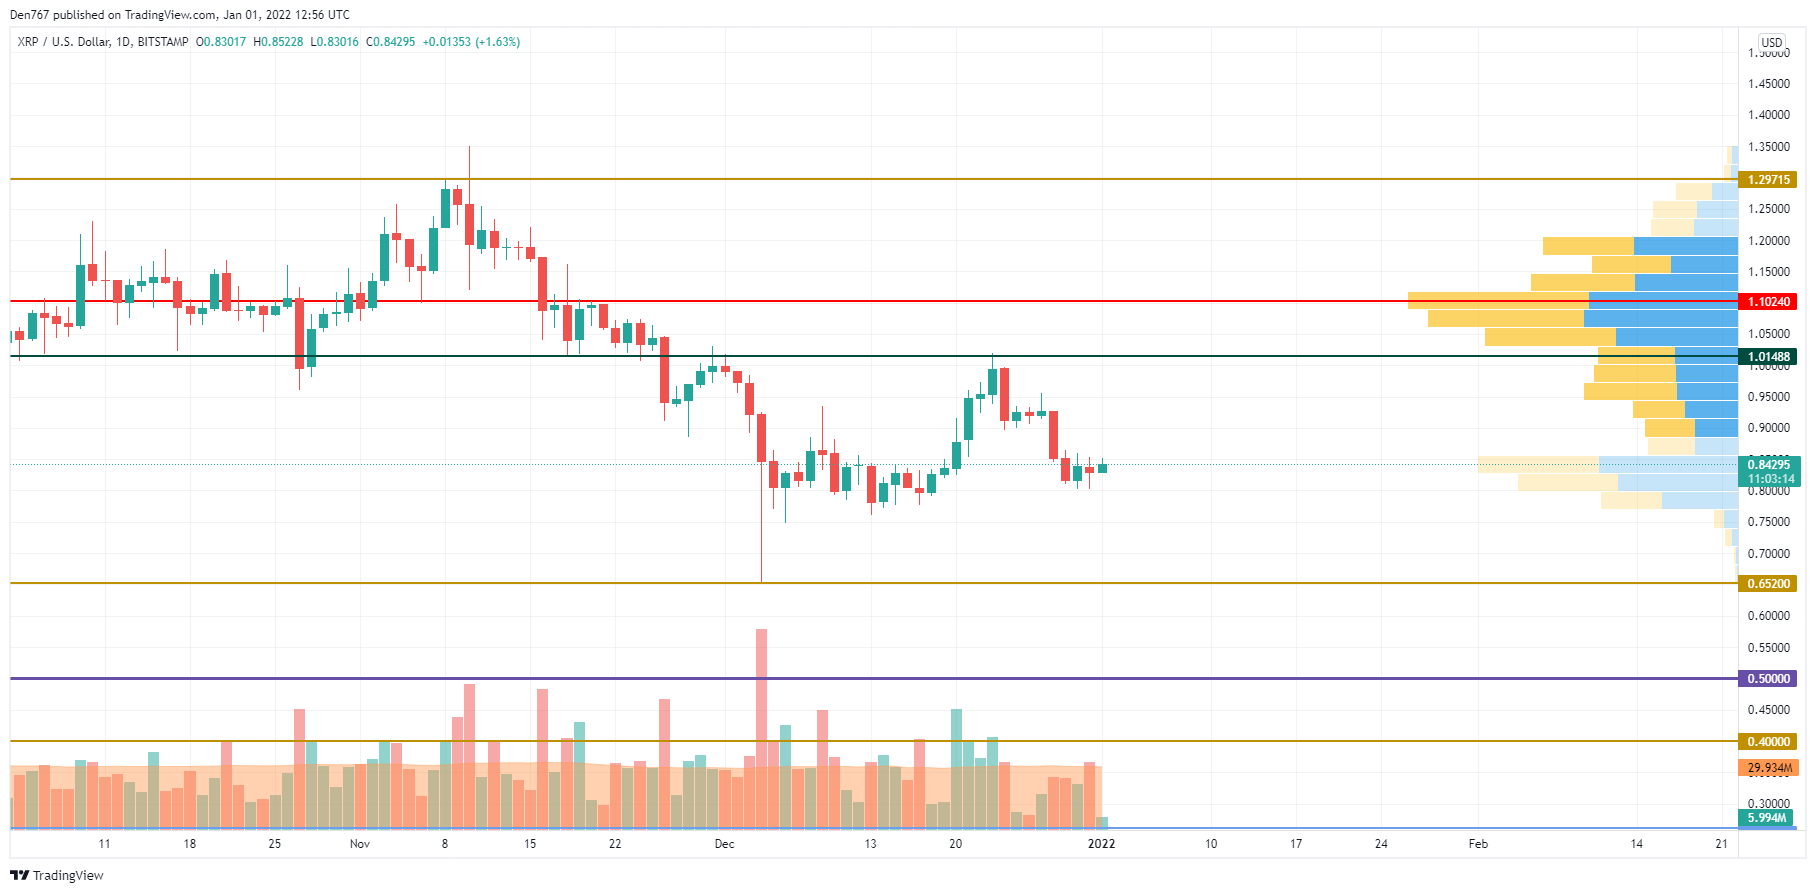
XRP is trading similarly to Bitcoin (BTC) as it is also located in a wide range. The volume is low, which means that bears are not ready to give up despite the price recovering to the area of $0.8.
If buyers cannot hold this mark, there is a high chance of seeing a prolonged drop to the nearest support at $0.652.
XRP is trading at $0.8440 at press time.
BNB/USD
Binance Coin (BNB) is not an exception today, falling by 1%.
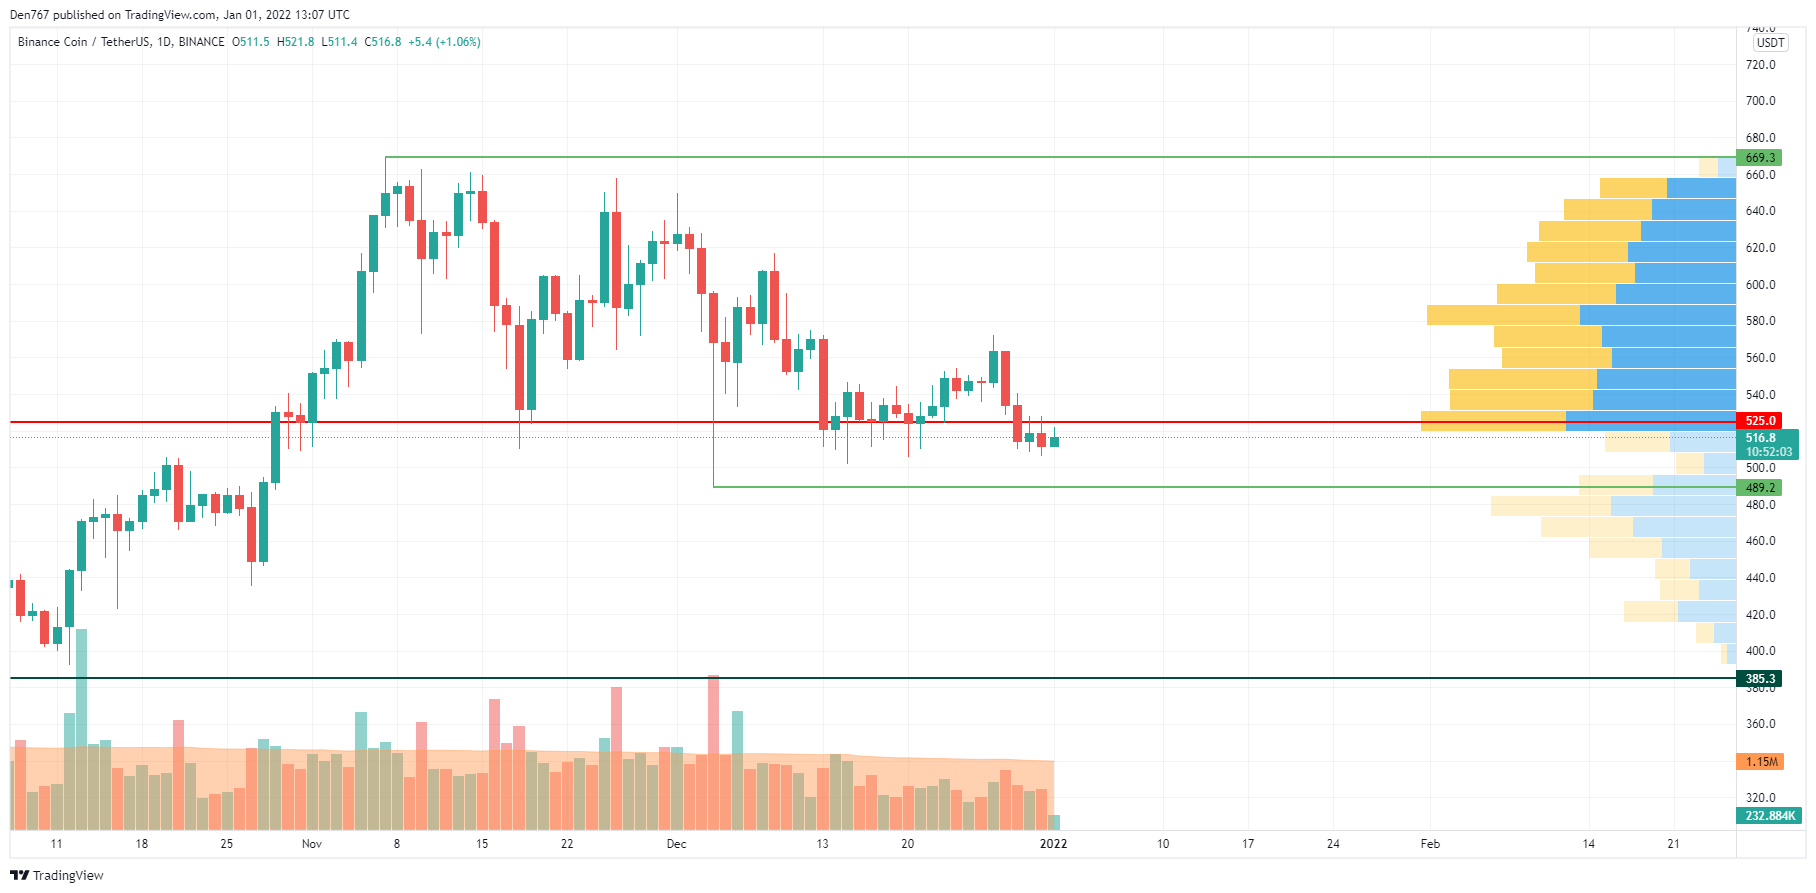
The price of the native exchange coin is located around the zone of the most liquidity around $525. The volume is low, which confirms the absence of strong buyers or sellers. Respectively, the price might continue declining if the daily candle fixes below $489. Such a scenario is relevant within the next few weeks.
BNB is trading at $517.6 at press time.
 Dan Burgin