*** Please note the analysis below is not investment advice. The views and opinions expressed here are solely those of the author and do not necessarily reflect the views of U.Today. Every investment and trading move involves risk, you should conduct your own research when making a decision.
Looks like Bitcoin has found some sort of support
After yesterday's downwards movement the market has been silent. There were some movements downwards in the night (UTC+3) but nothing remarkable, and now, the prices are the same as they were in yesterday's evening.

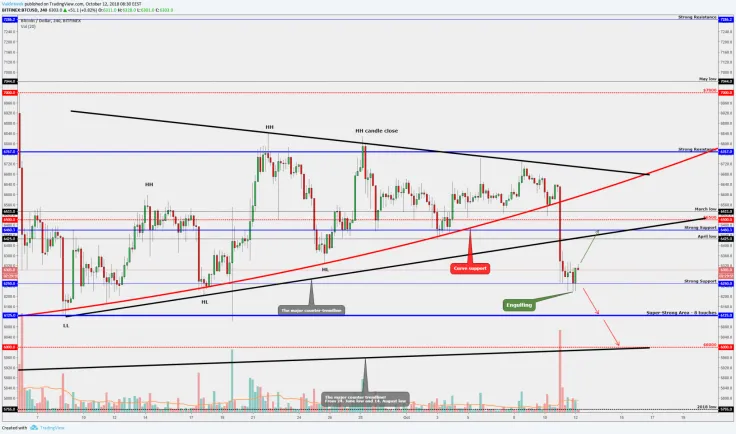
Currently, BTC has found a support area from $6,250. It made several attempts to go through this but only 15-minute candles are closed below the mentioned level. Higher and important time frames are all rejected upwards from $6,250. So, the chart has collected some data and the support is confirmed.
The last four-hour candle was very bullish and we can see a bullish candlestick pattern which is called "Engulfing". The Engulfing pattern consists of two candles and the last bullish candle 'eats' the previous low candle completely. Those candlestick patterns are usually very good when they are on the strong support or resistance area. Currently, it is a confirmed support area and let's see how it plays out.
To see a bullish BTC we need to witness a Bart move — a quick move downwards, a little consolidation and a quick move upwards. On the other hand, in order to confirm a bear trap, we need to see an upward movement today. Postponement to the weekend will bring a low percentage due to very low volume on weekends.
At the moment the price has formed a Bullish Engulfing pattern and the reason to go higher is solid. However, if we get a one-hour or a four-hour candle close below the $6,235-$6,250 then it is a bearish confirmation and we could see another 'leg' downwards.
NEO (NEO/USD) could start to approach the 2018 low level
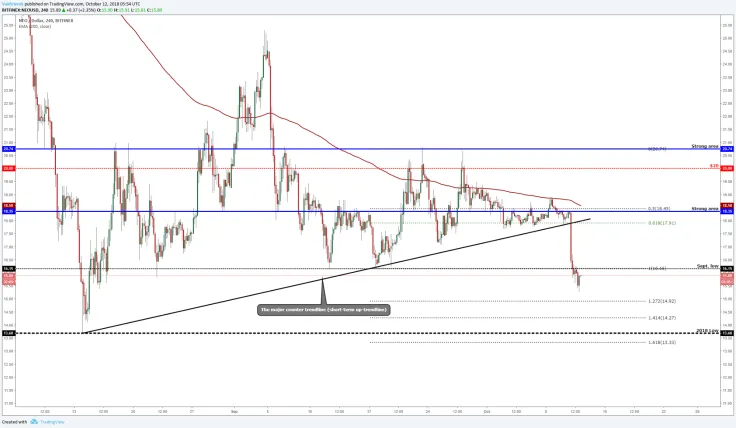
Almost all the altcoins have made a breakout below the major counter-trendline which indicates bearishness and at the moment NEO is 13 percent down from the yesterday's crash and it trades below the mentioned trendline and below the support levels.

It has broken all the important support levels and the only one that is left is an August low level which is also 2018 lowest point at $13.68. If the market doesn't show us a power which will guide us to the higher prices then NEO will start approaching the 2018 low level.
Around this area are also Fibonacci extension levels, at $14.27 there is a 141 percent extension and at $13.33 there is a 161 percent extension.
To invest into the NEO is a bit risky because the current bounce came from nowhere and we don't have a clear picture of what it could do next and currently NEO price movement depends very strongly on Bitcoin movement.
TRON (TRX/USD) is the strongest coin on the market
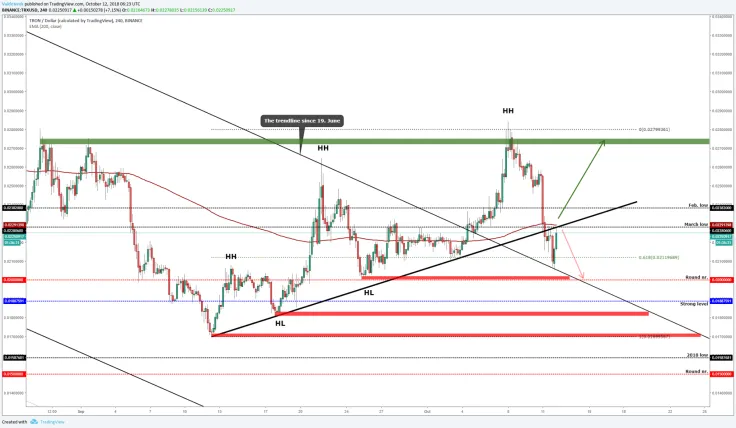
One of the strongest coins on the market is TRON. Yes, it also came down pretty sharply as all altcoins did but the price action is wise and technically Tron has a very good shape. Some altcoins printed new 2018 low (ETC) and some of them are approaching the 2018 low levels, but not TRON. It is far from the 2018 low point and it has multiple strong supports before that level.

It can sound unbelievable but the current bounce came from the new higher low (HL) area. This is a big statement and shows that Tron is 'healthy'. Besides that the bounce came from the new HL area, there is also other criteria: the golden Fibonacci retracement level 62 percent and the trendline since June 19, which worked nicely as a support after a breakout above the trendline on Oct. 4. We can say that this was a retest.
If the bounce momentum continues then the next resistance is the March low, the counter-trendline and the 200 EMA crossing area at $0.0228. If the price manages to push through from the mentioned levels then it is out of the danger zone and back above the 200 EMA and above the major counter-trendline which will indicate that the momentum will continue and we go and retest the green area above the current price.
Here are dangers also, the resistance — crossing area — is pretty strong and if the market doesn't show the power to go upwards then it can mean that we go and test the lower levels and the major supports which are marked with red boxes.
 Vladislav Sopov
 Dan Burgin