Disclaimer: The opinions expressed by our writers are their own and do not represent the views of U.Today. The financial and market information provided on U.Today is intended for informational purposes only. U.Today is not liable for any financial losses incurred while trading cryptocurrencies. Conduct your own research by contacting financial experts before making any investment decisions. We believe that all content is accurate as of the date of publication, but certain offers mentioned may no longer be available.
Bulls could not keep yesterday's growth up, and most of the coins have returned to their previous levels.

BTC/USD
Bitcoin (BTC) is again trading below the $40,000 mark, going down by almost 7% over the last 24 hours.
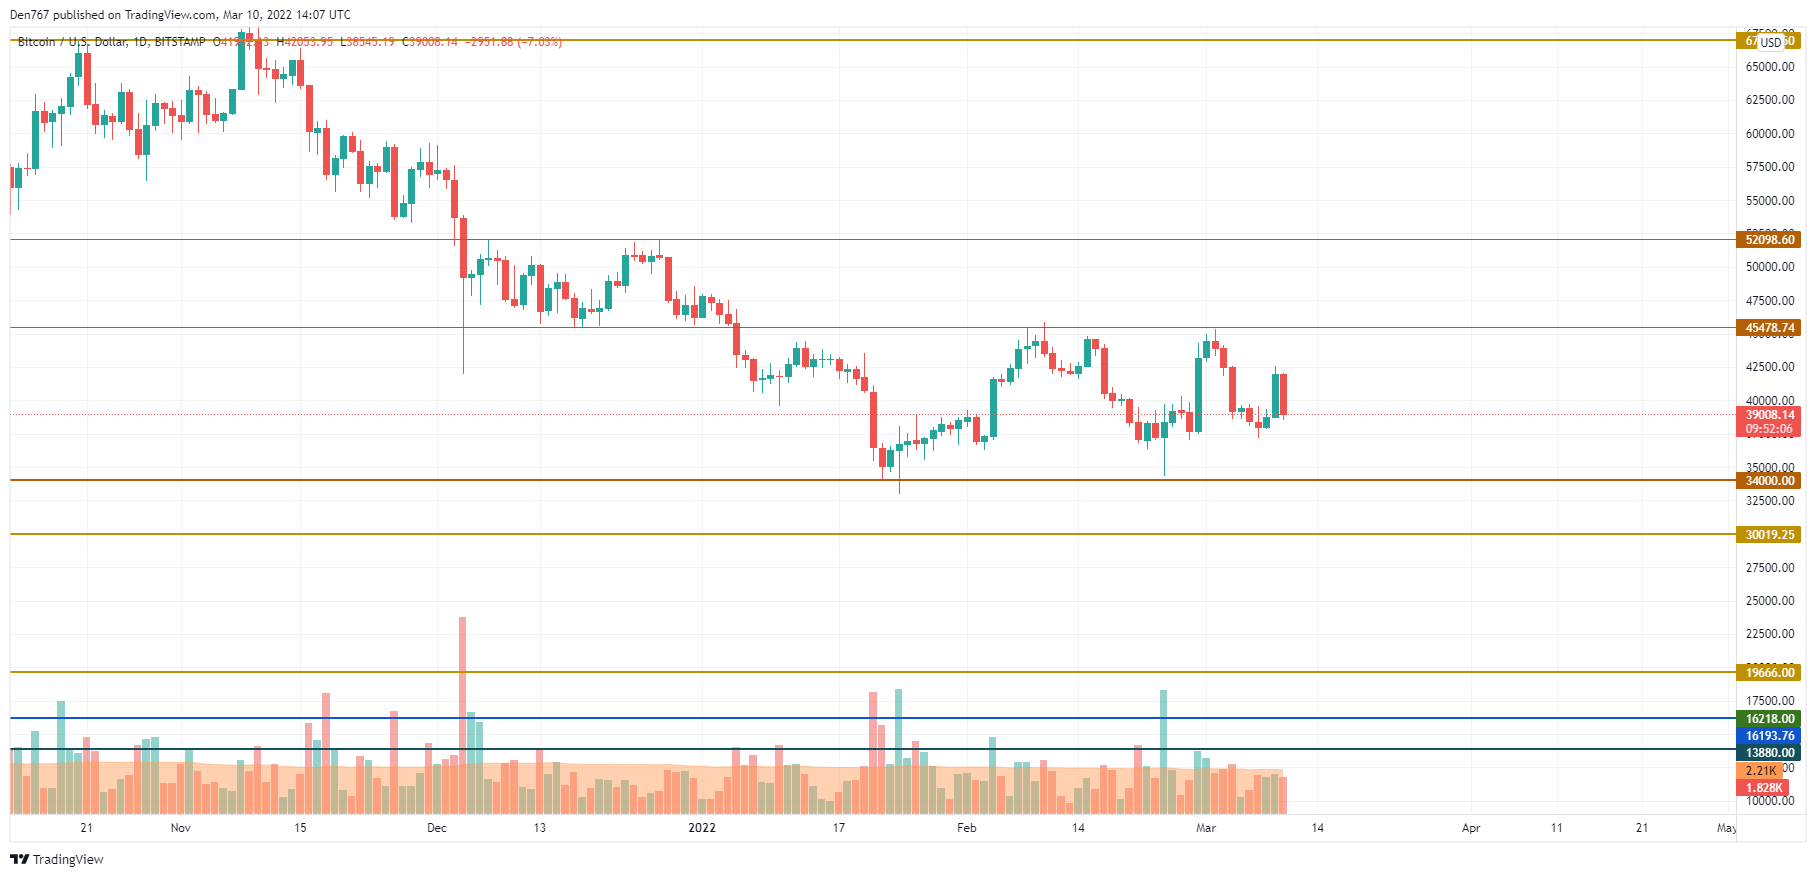
Despite the fall, Bitcoin (BTC) keeps trading in a wide channel between the support at $34,000 and the resistance at $45,478. The volume is increasing, which means that the coin is accumulating power for a further sharp move. If buyers cannot return above $40,000, there is a high possibility to see the retest of the resistance shortly.
Bitcoin is trading at $39,049 at press time.
ETH/USD
Ethereum (ETH) has lost less than Bitcoin (BTC), with a price drop of 5.66%.
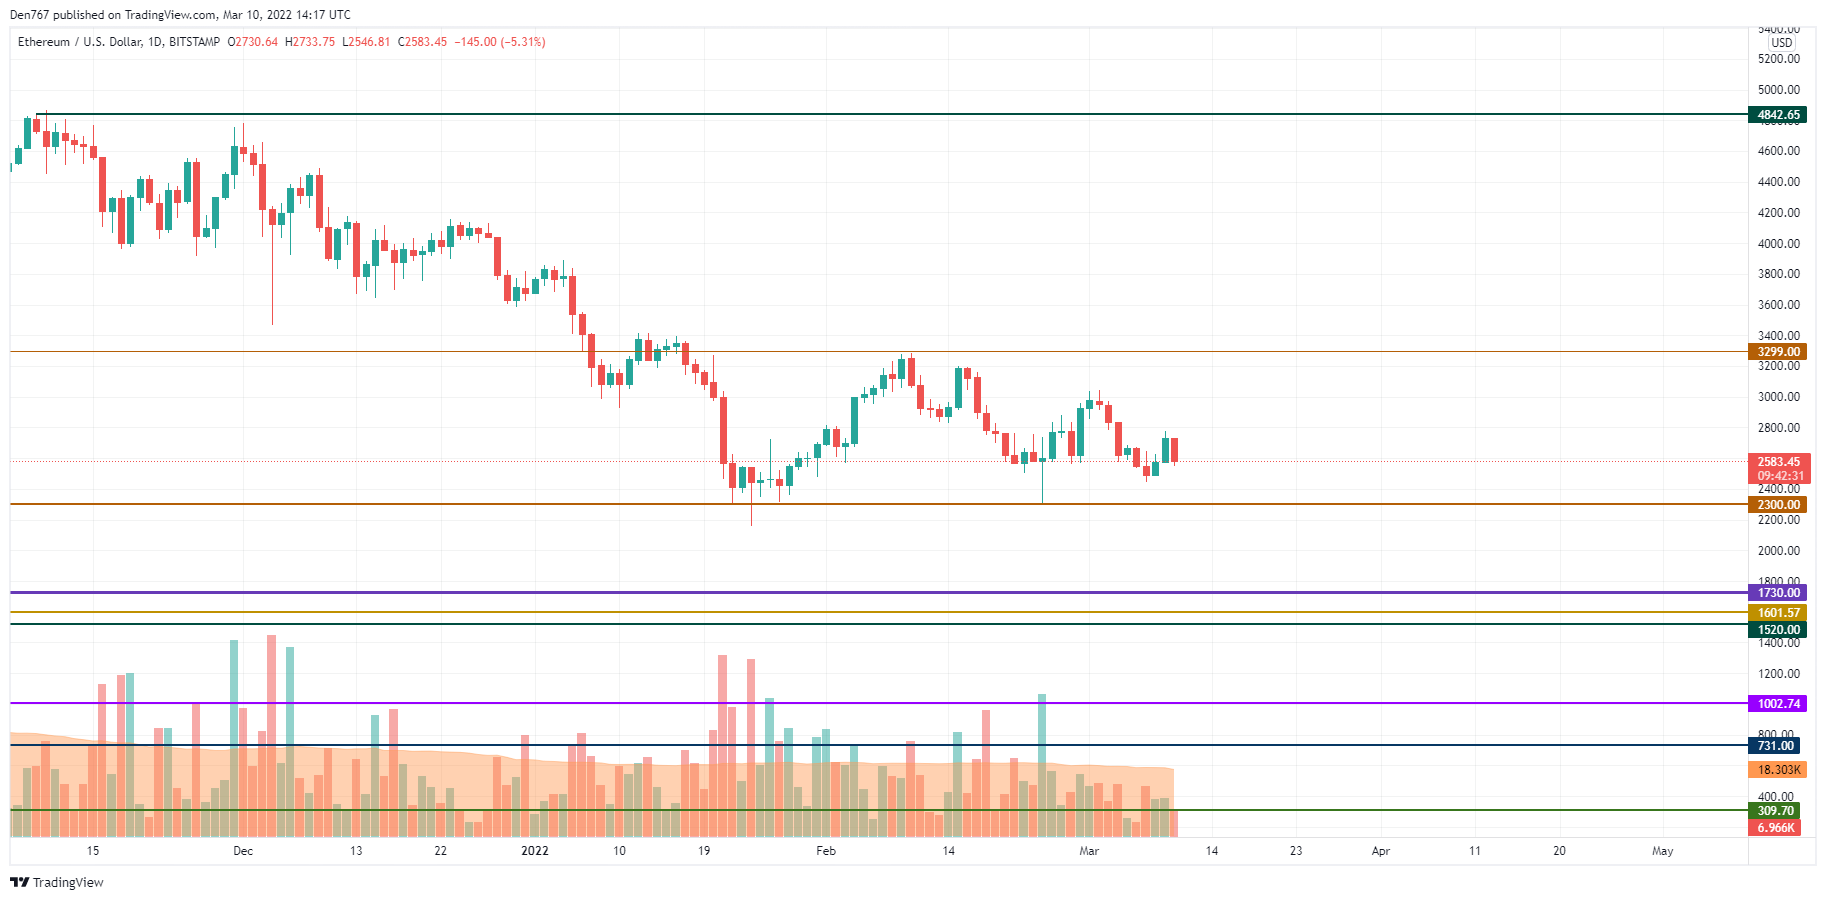
Ethereum (ETH) is showing the same price action as Bitcoin (BTC). The rate is stuck in the channel with neither bearish nor bullish signals. However, the price is slowly approaching the bottom lower level, confirming the bears' power.

If buyers cannot hold the $2,500 mark, the drop may go below $2,000. Such a scenario could take place within the next few days.
Ethereum is trading at $2,582 at press time.
XRP/USD
XRP has dropped the least with a decline of 2.44%.
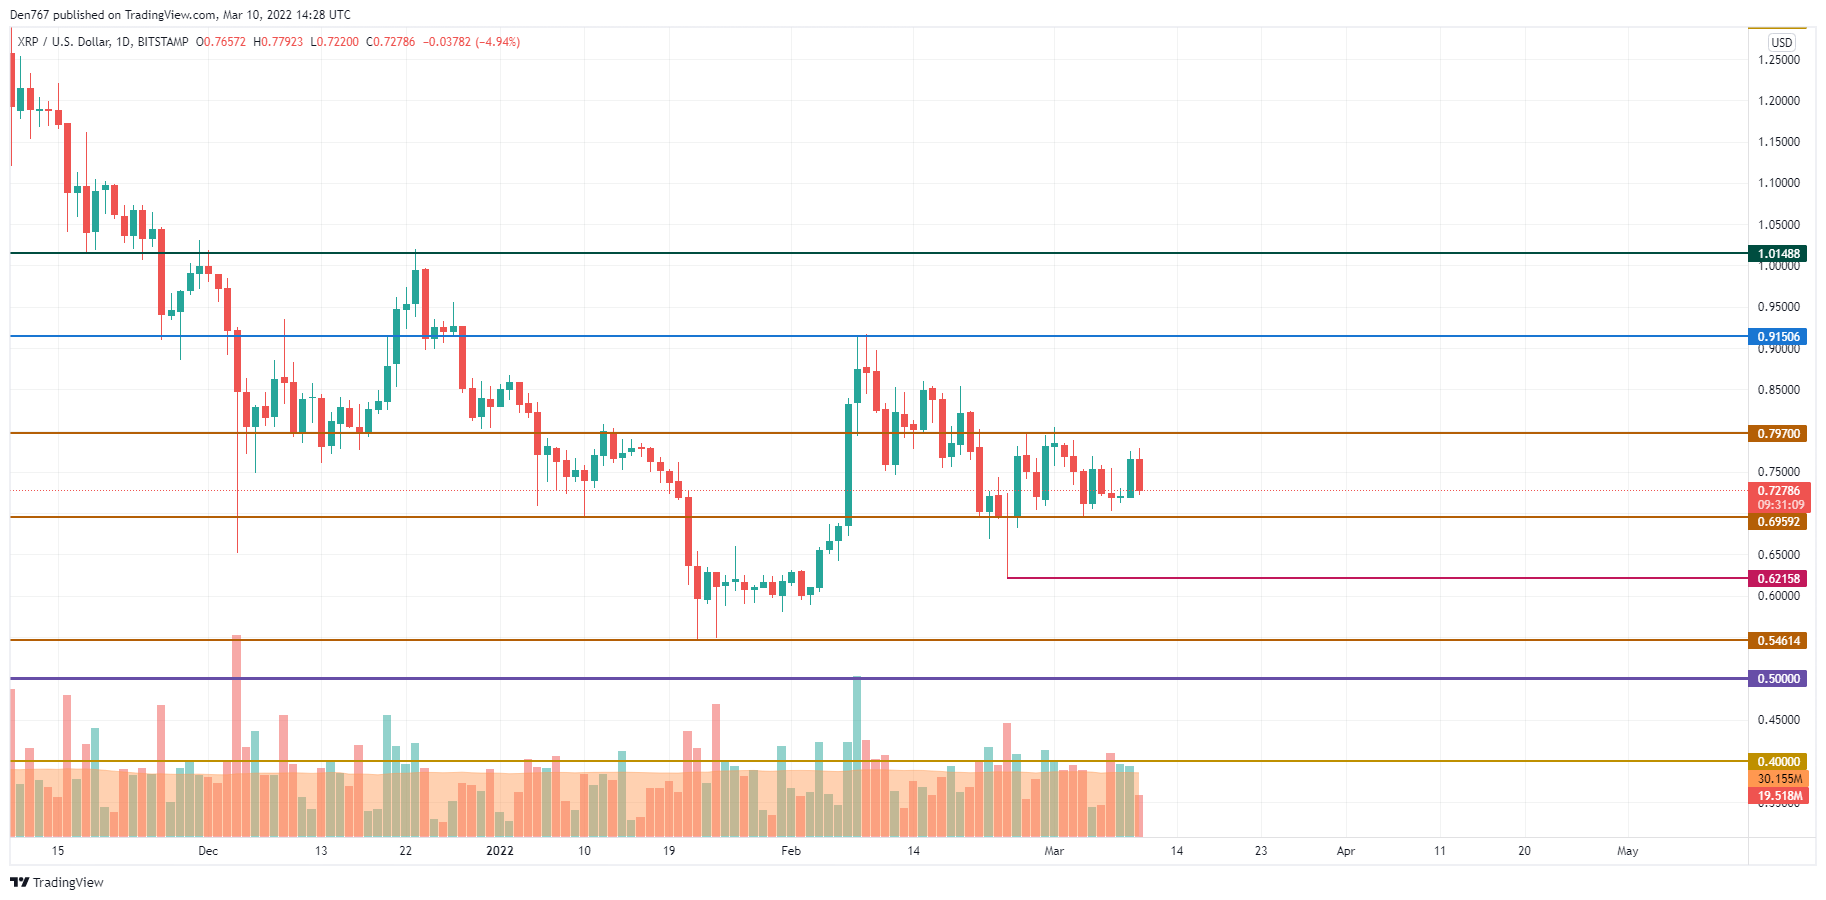
XRP is going down after a failed attemp to fix above the $0.75 mark. Currently, the price is about to test the support level at $0.6959. If the pressure continues, a sharp decrease may lead the price of XRP below $0.65 until mid-March.
XRP is trading at $0.7277 at press time.
 Dan Burgin