Disclaimer: The opinions expressed by our writers are their own and do not represent the views of U.Today. The financial and market information provided on U.Today is intended for informational purposes only. U.Today is not liable for any financial losses incurred while trading cryptocurrencies. Conduct your own research by contacting financial experts before making any investment decisions. We believe that all content is accurate as of the date of publication, but certain offers mentioned may no longer be available.
The weekend has begun with an ongoing fall for most of the coins from the top 10 list.
BTC/USD
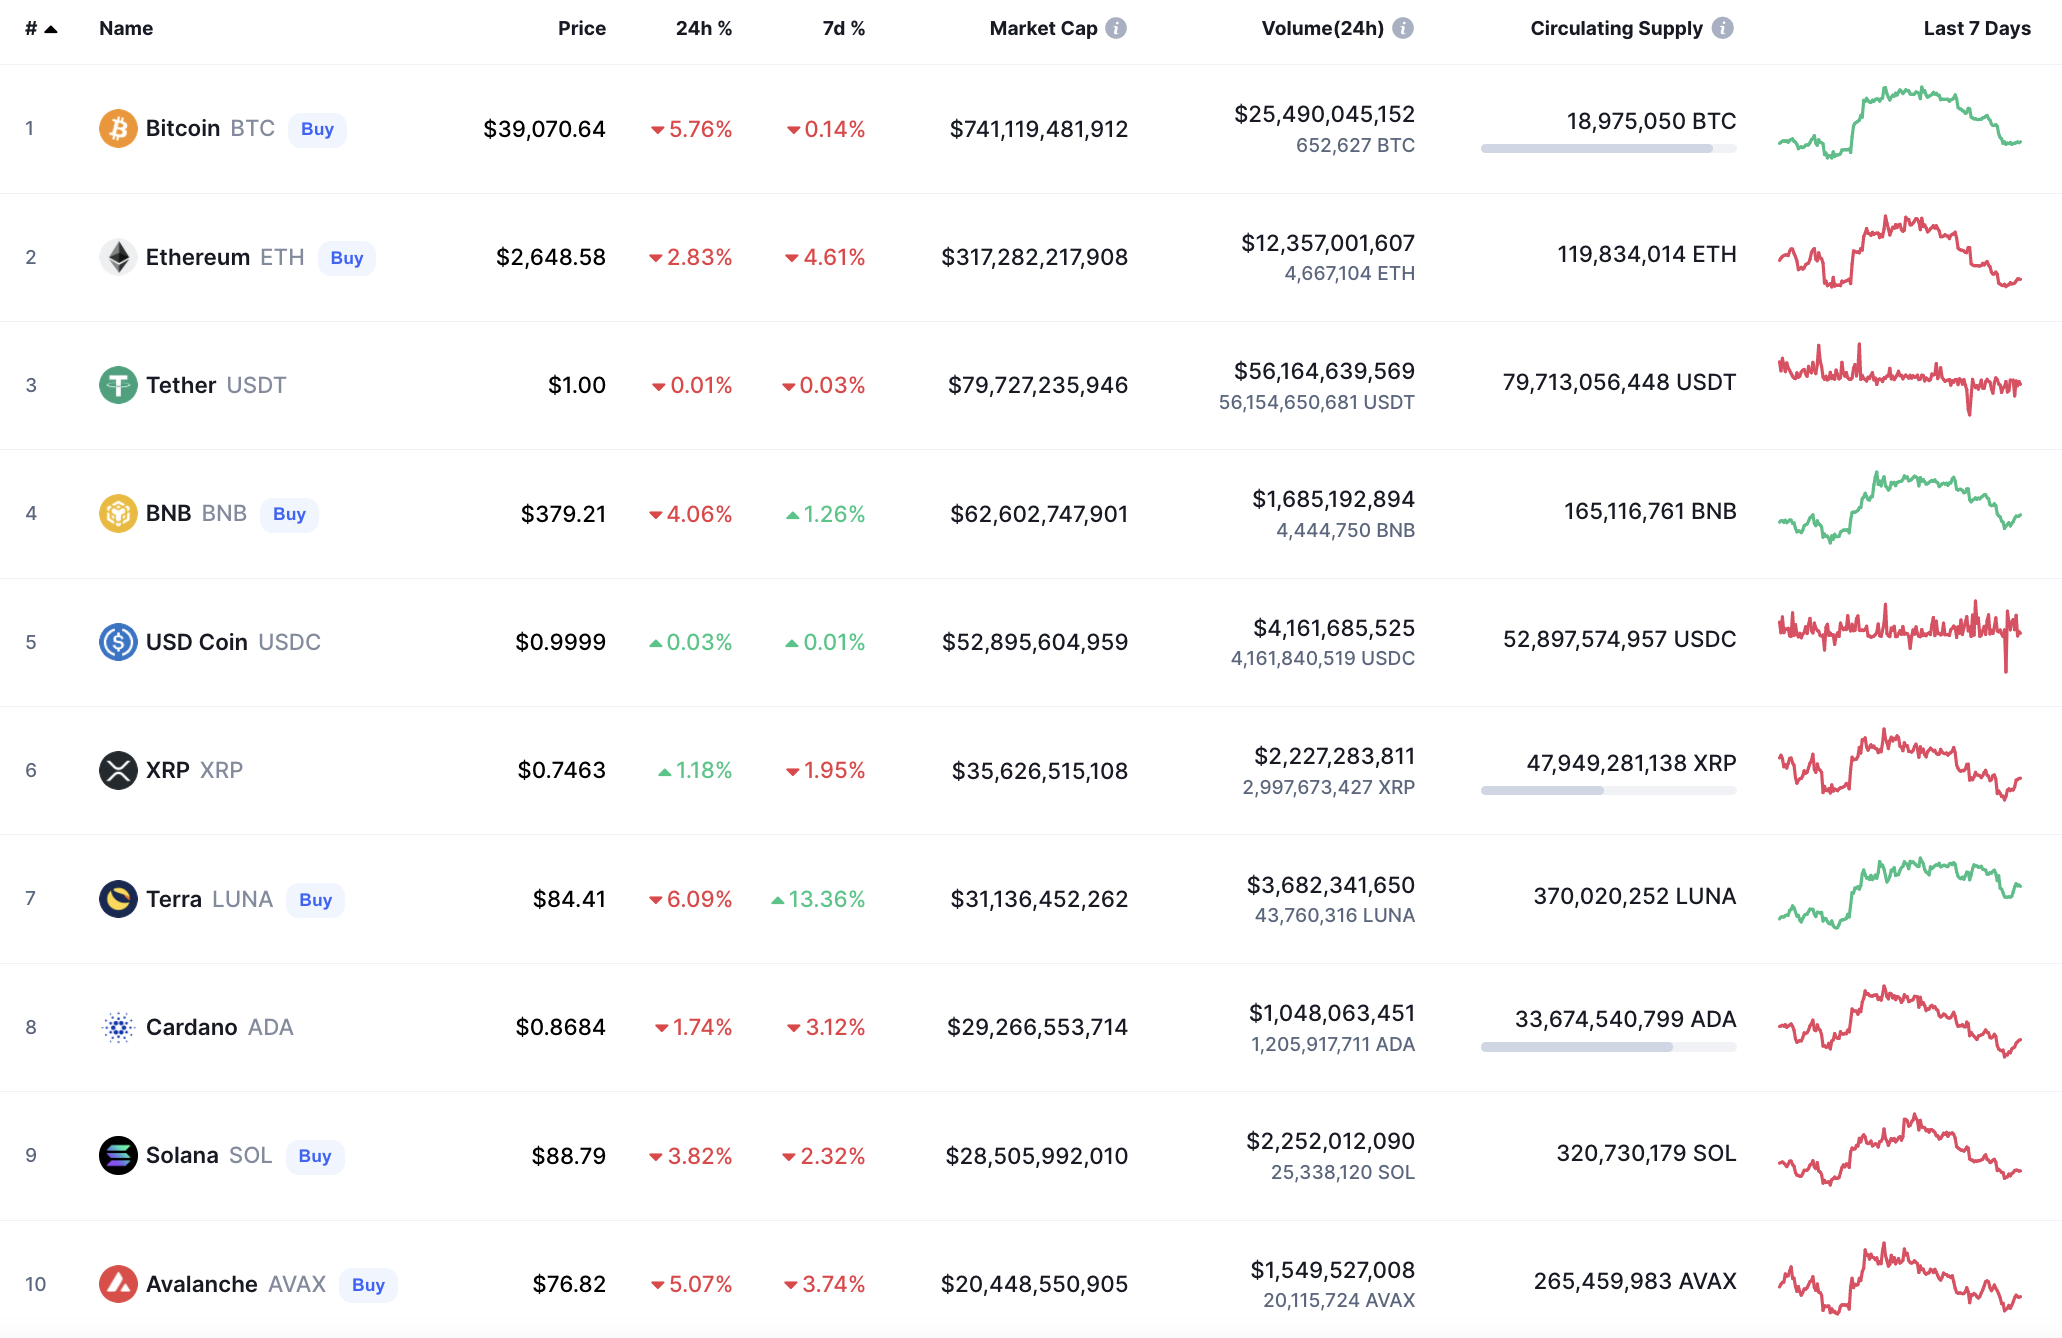
The rate of Bitcoin (BTC) has declined by 6% over the last day.
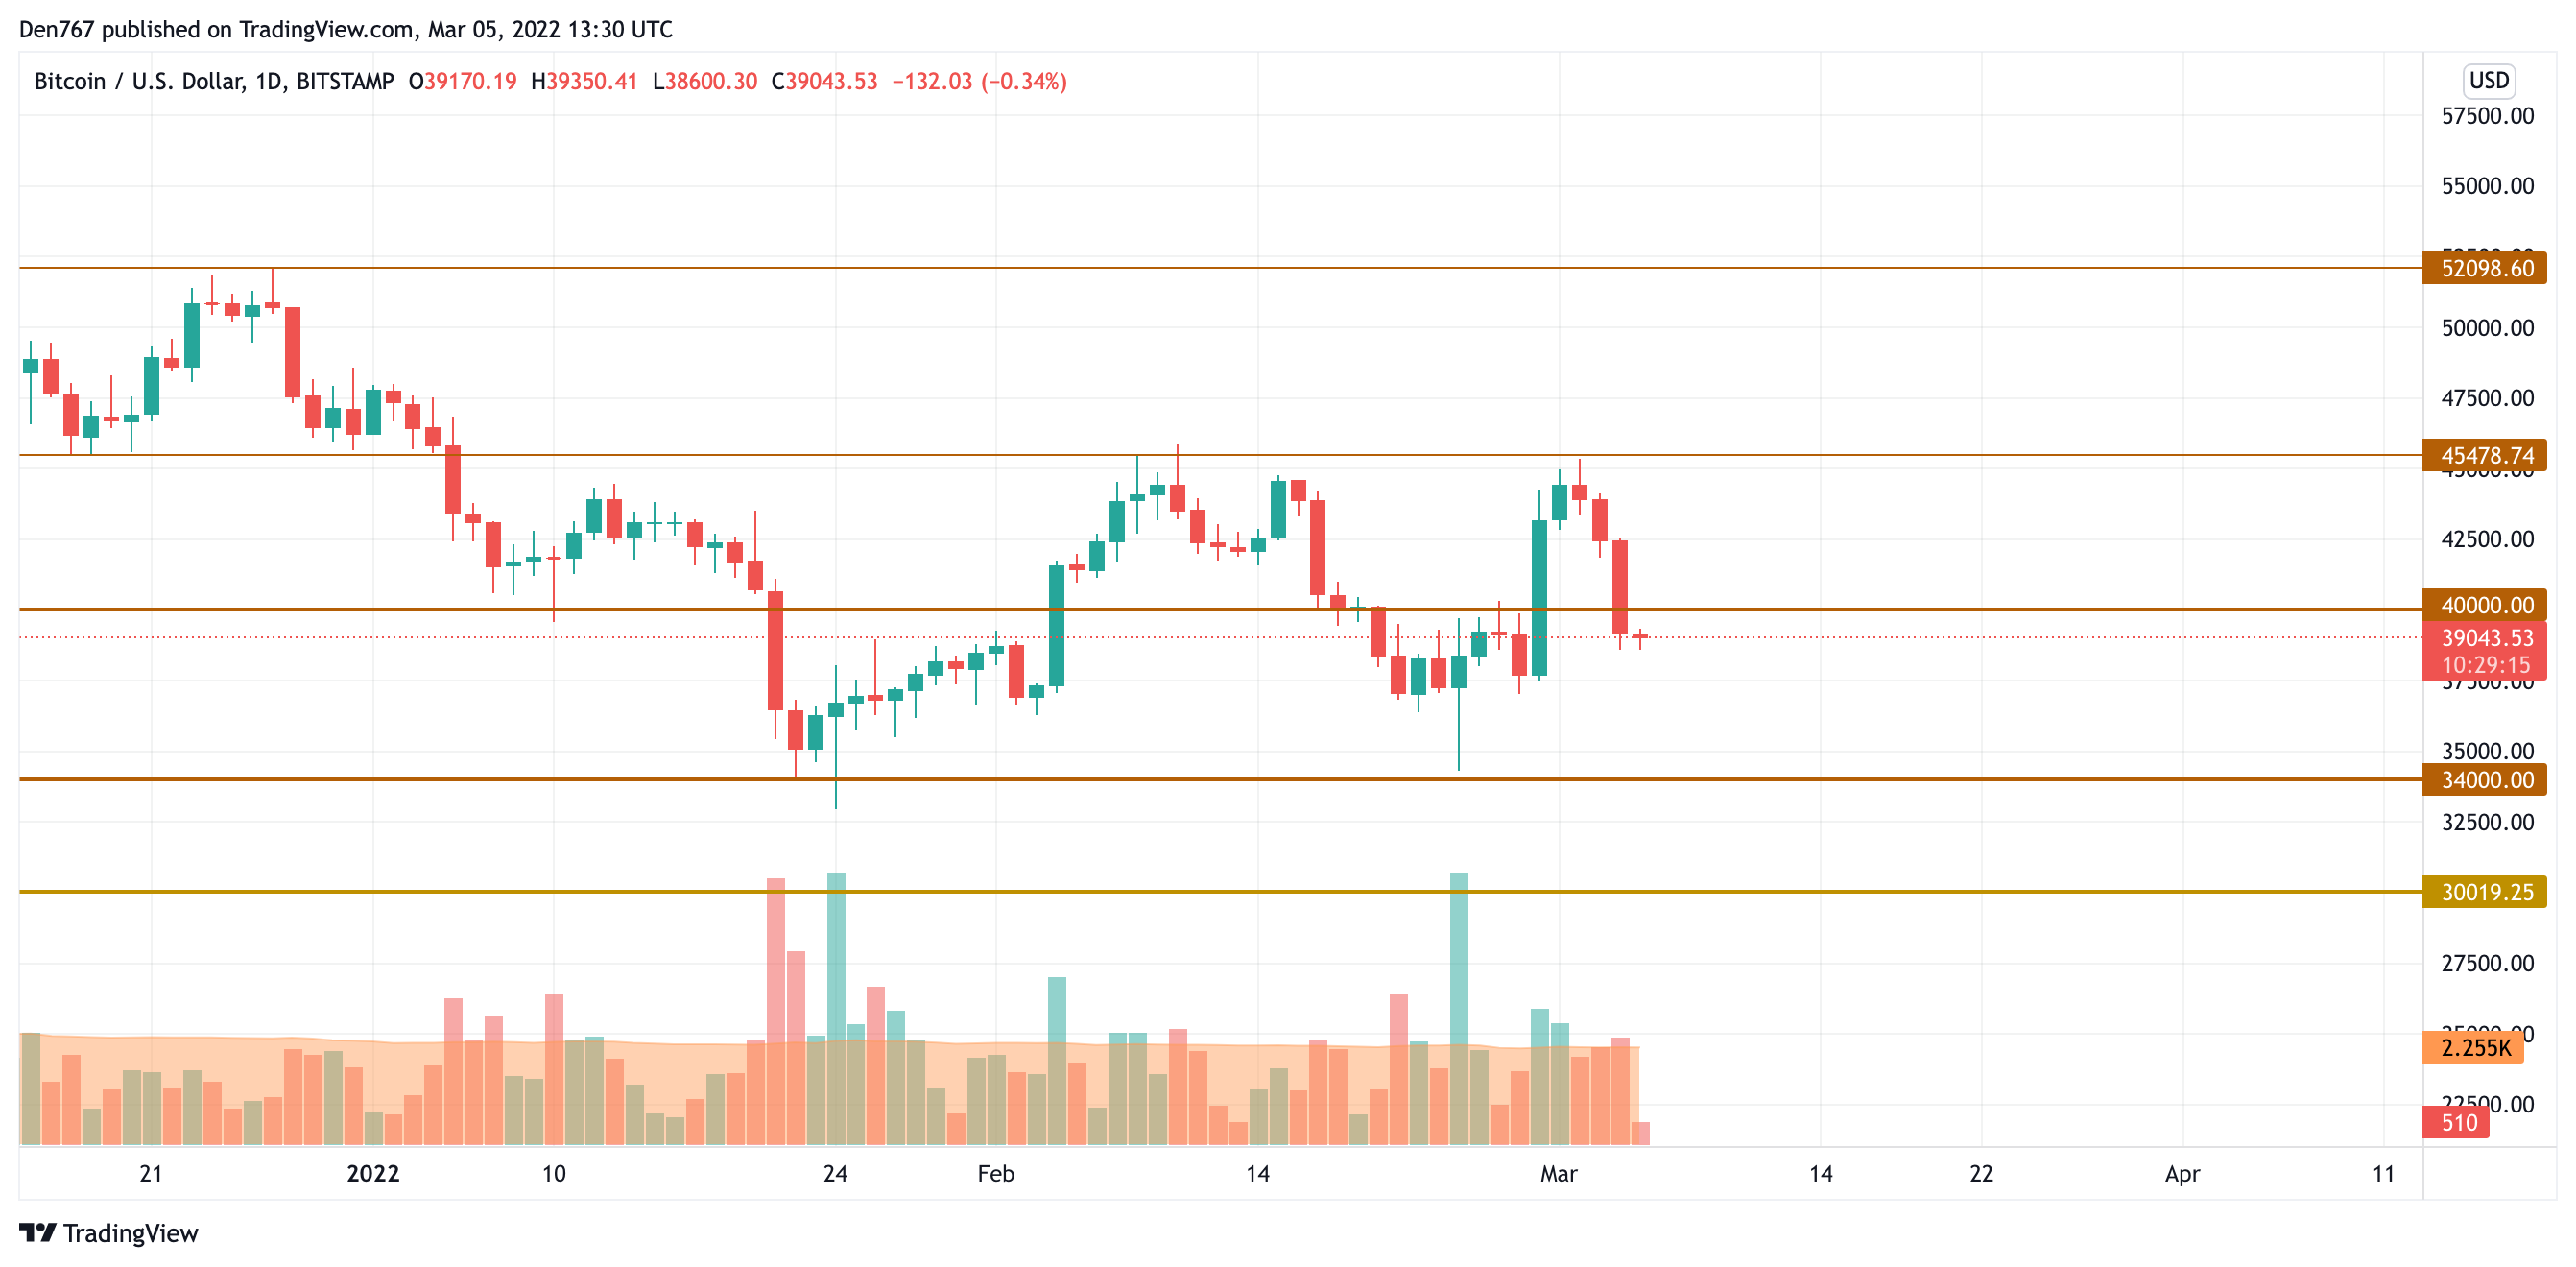
Bitcoin (BTC) has entered the bearish zone after the breakout of the support level at $40,000. The selling trading volume remains high, which means that the fall may continue.
In this case, the price decrease may get the price of the main crypto to the next support at $34,000.
Bitcoin is trading at $39,043 at press time.
ADA/USD
Cardano (ADA) has lost less than Bitcoin (BTC) as the price drop has accounted for 2.95%.
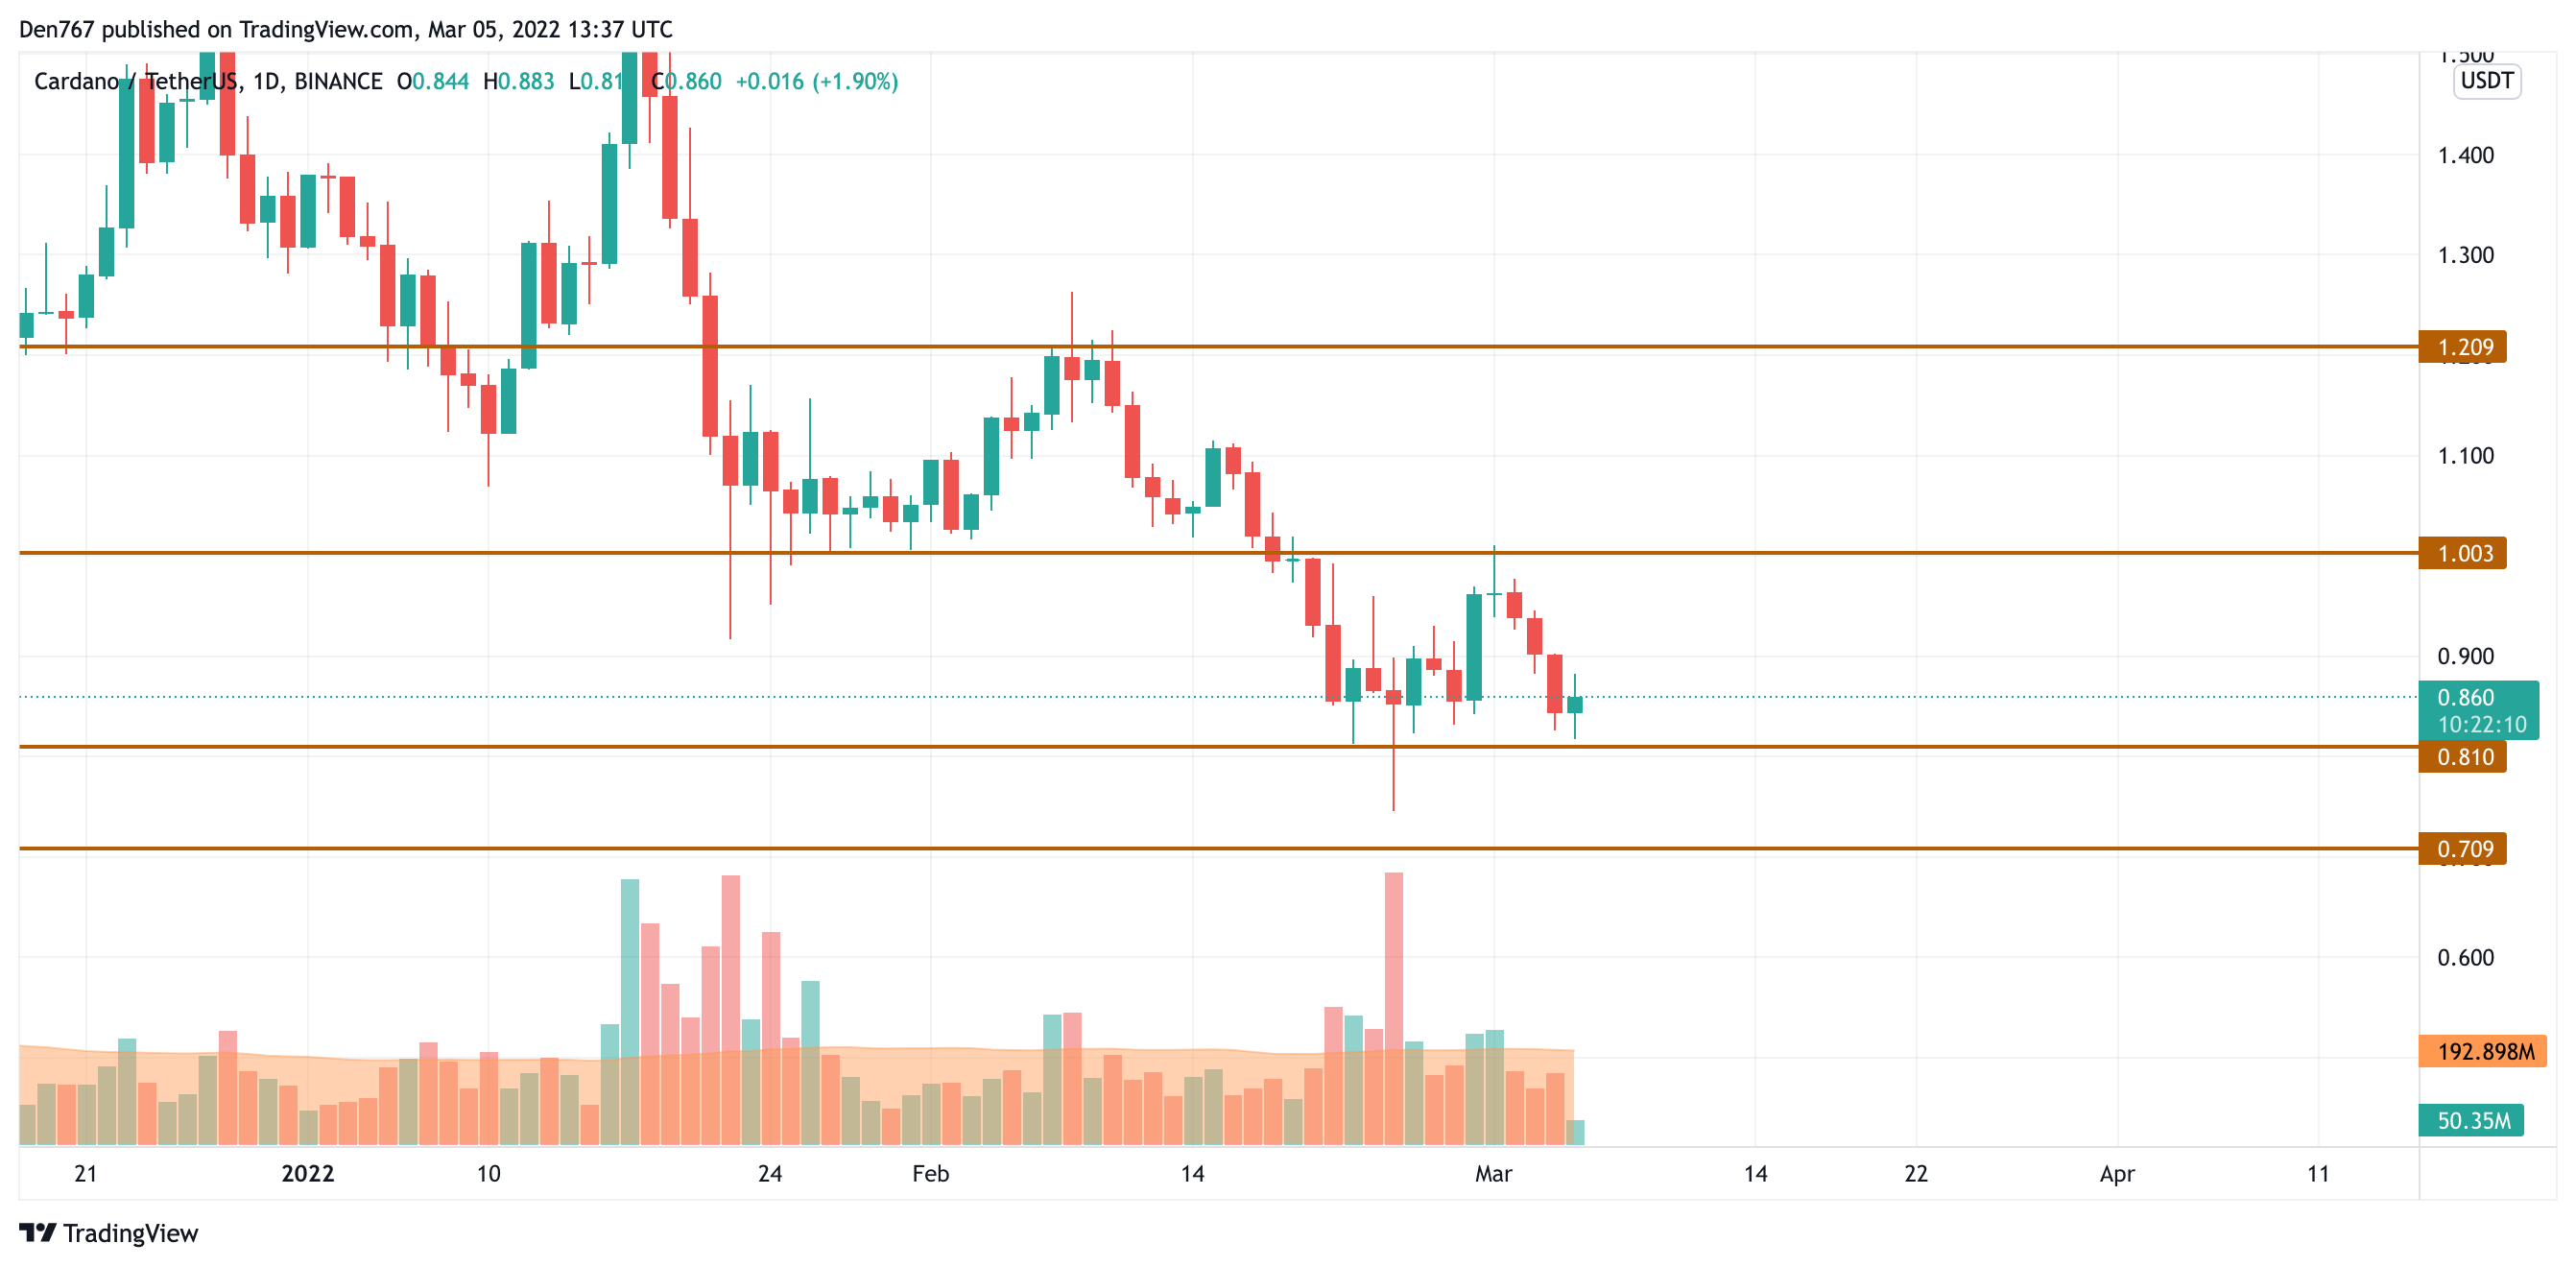
On the daily chart, Cardano (ADA) remains trading above the support level at $0.81, which means that bulls keep controlling the situation on the market.
However, if the pressure continues and a breakout occurs, the fall may get to the $0.70 mark next week.
ADA is trading at $0.86 at press time.
BNB/USD
Binance Coin (BNB) has followed the decline of BTC, going down by 4.23%.
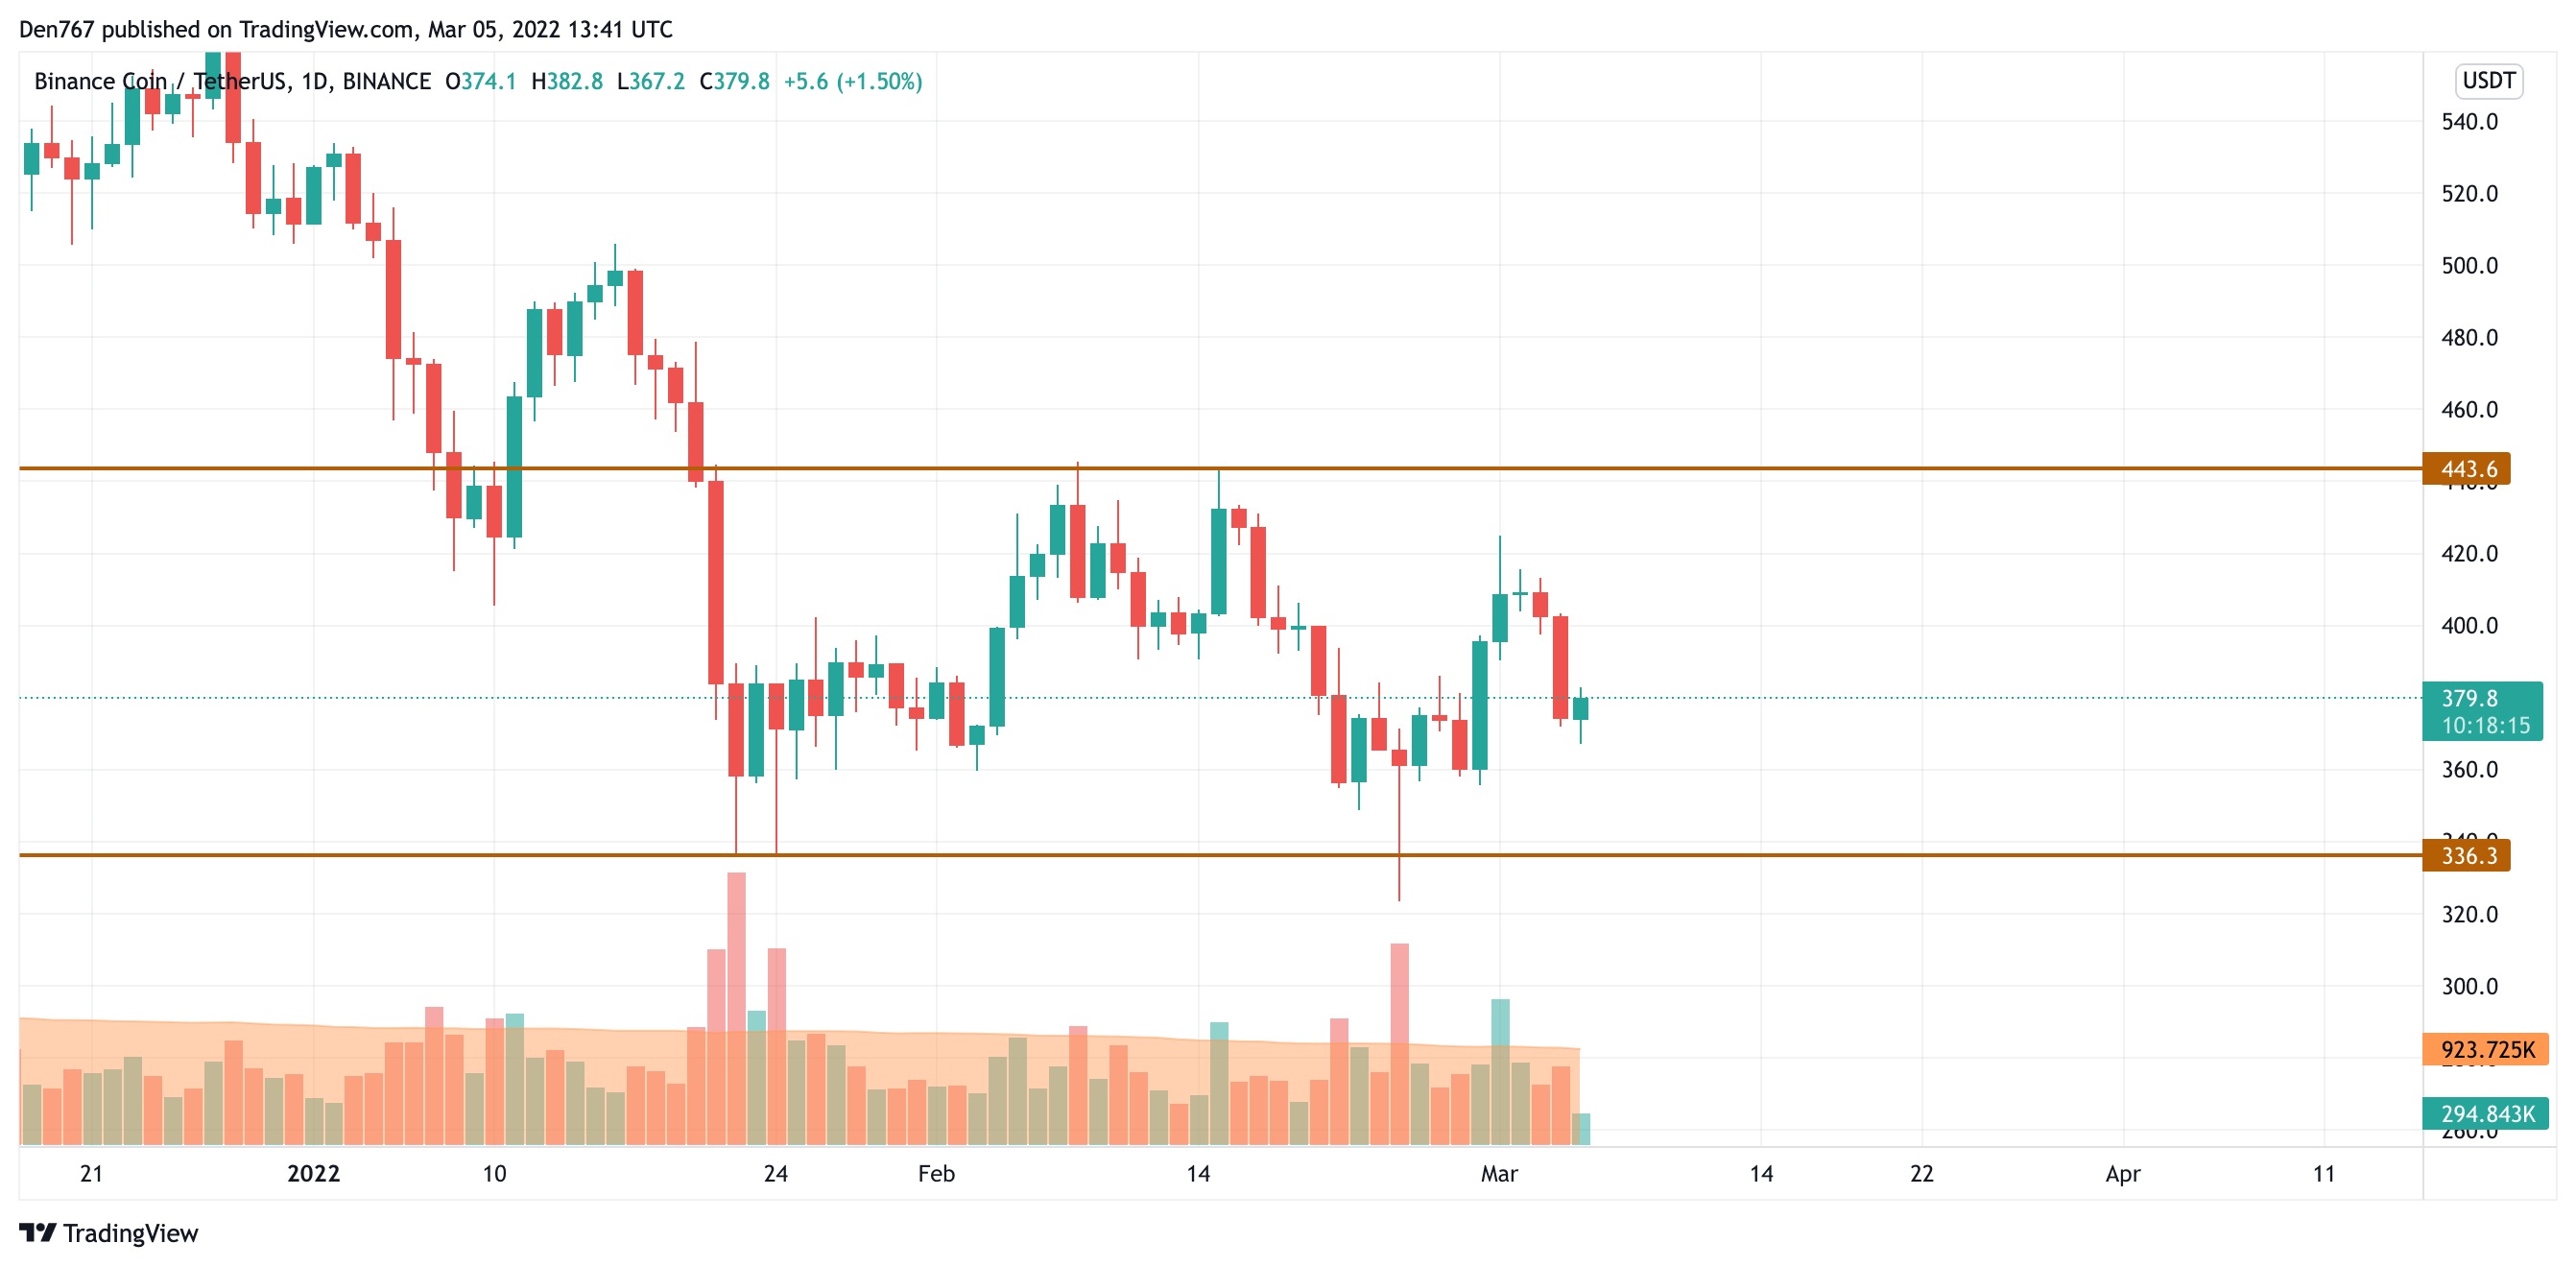
From the technical point of view, the rate is located in the middle of the wide channel between the support at $336 and the resistance at $443. Until the price is below the important $400 mark, bears remain more powerful than bulls. In this case, there is a high possibility to see the test of the $336 mark soon.
BNB is trading at $379 at press time.
LUNA/USD
LUNA is the biggest loser from our list today as the coin has fallen by 7.53%.
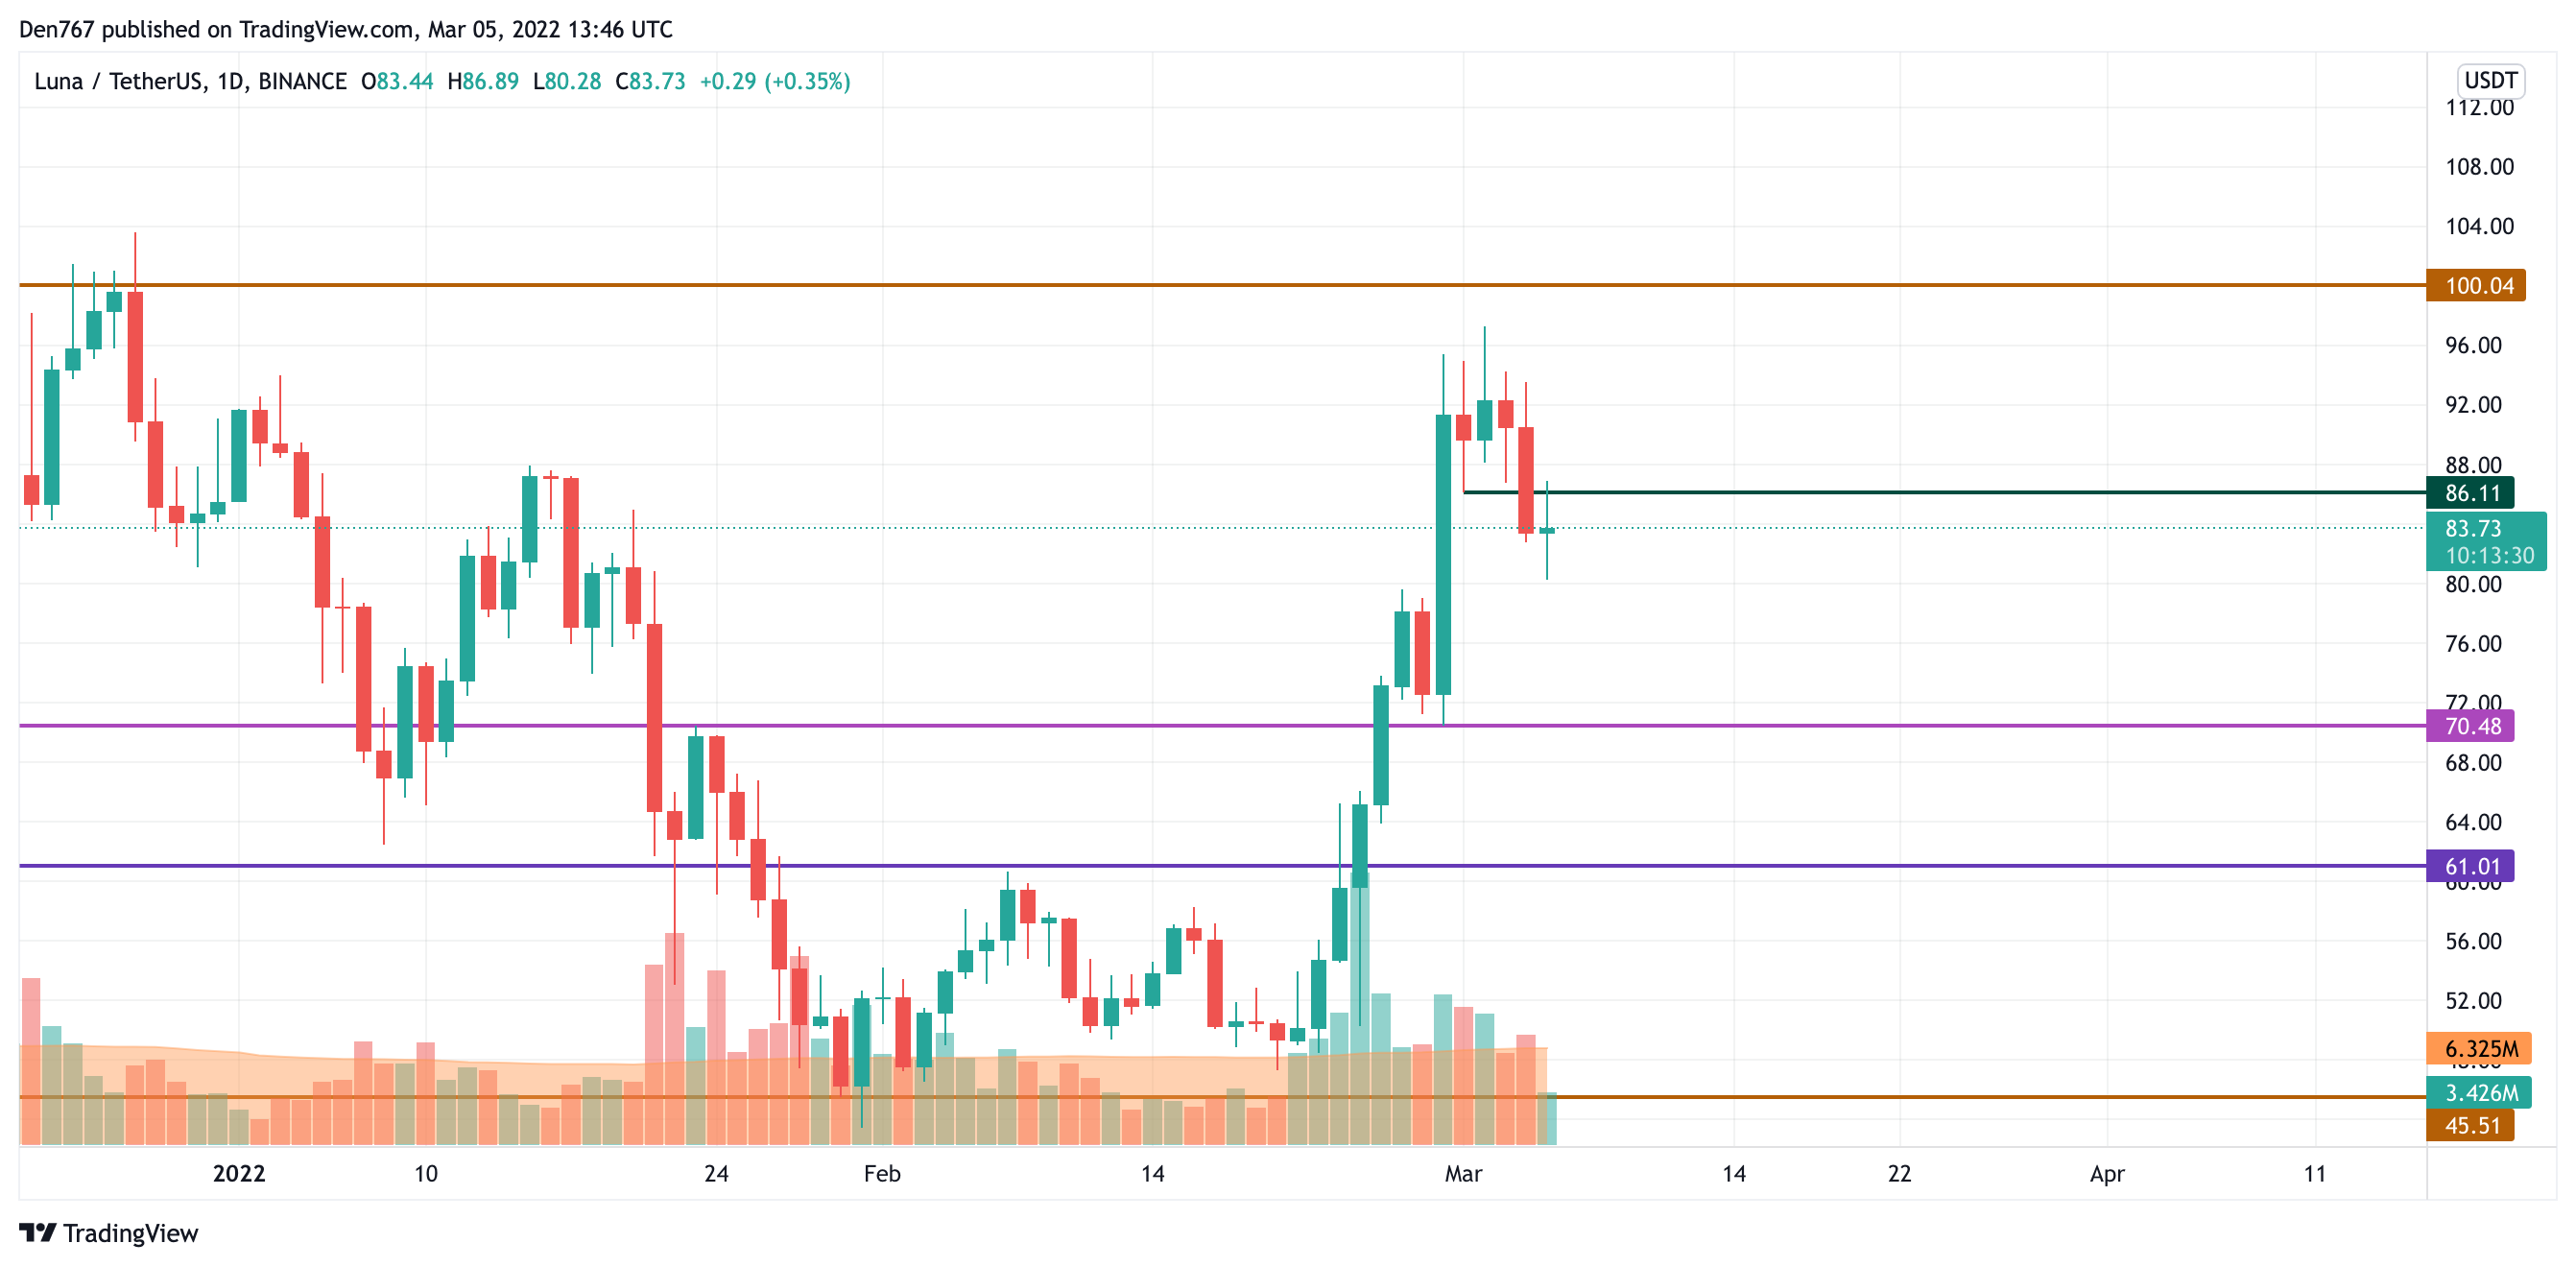
Currently, the price is below the level of $86, which means that sellers prevail over buyers. If nothing changes and bulls cannot seize the initiative, there is a chance to see a continued decrease below the vital $80 mark. Such a scenario is relevant until the end of the upcoming week.
LUNA is trading at $83.73 at press time.
SOL/USD
Solana (SOL) is no exception to the rule, going down by 4.77%.
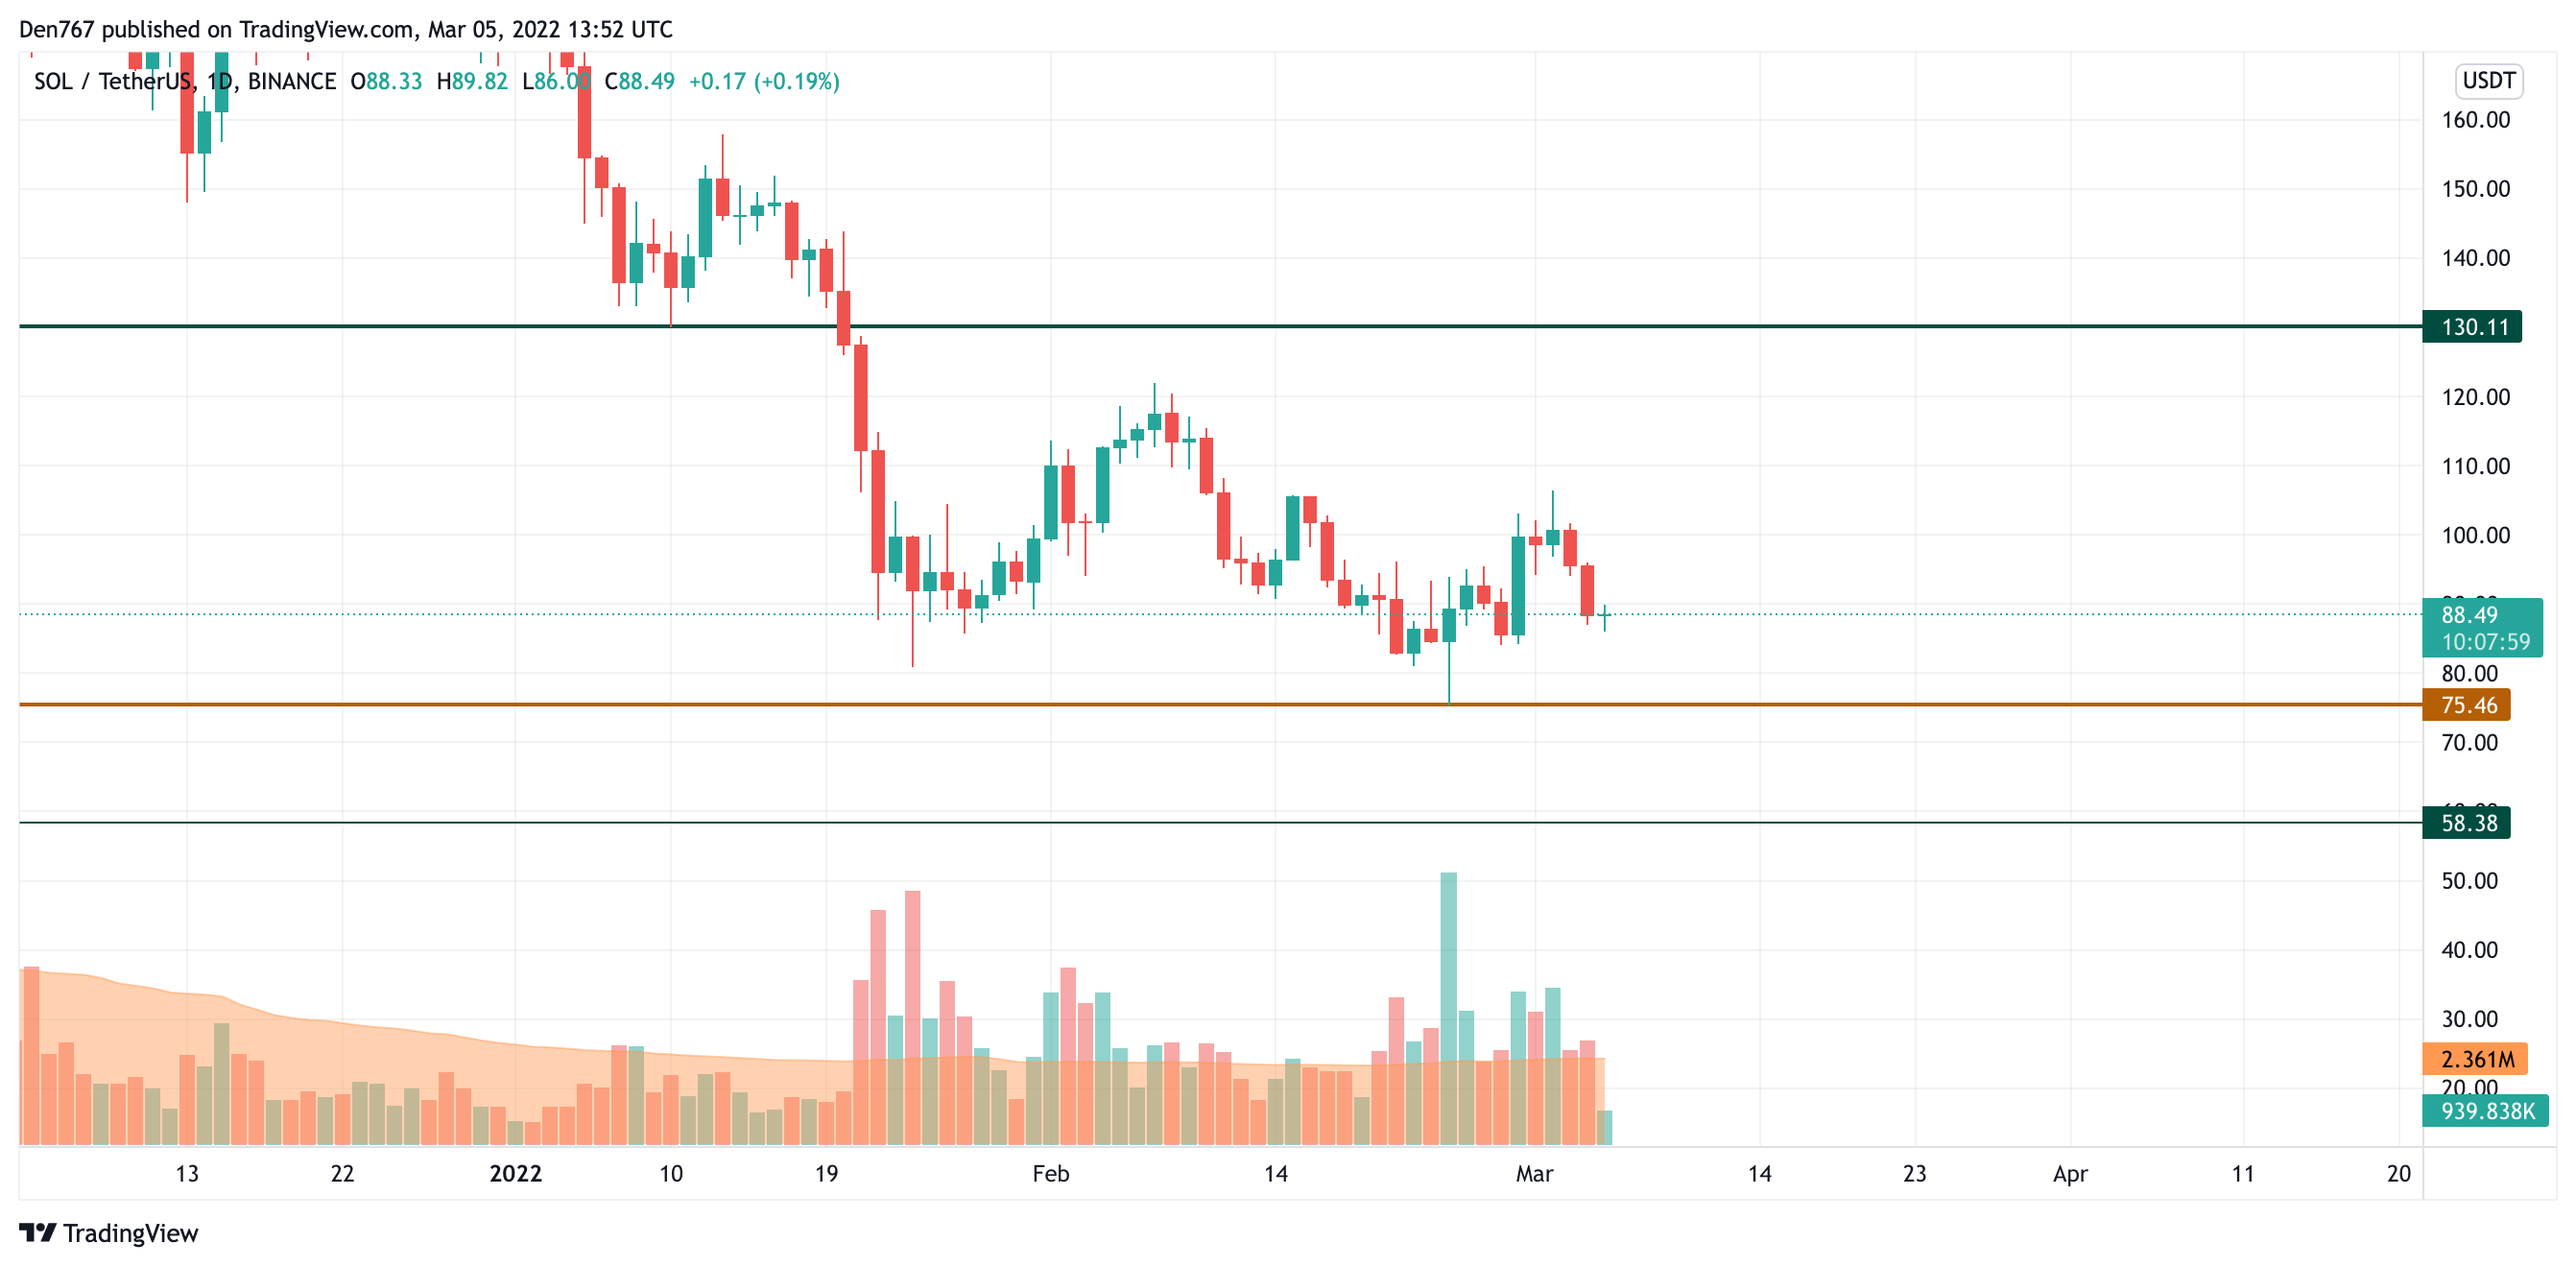
Solana (SOL) remains weak as it could not come back to the zone around $100. At the moment, it is approaching the support level at $75. If the daily candle fixes below it, one can expect a sharp drop to the area of $50-$60 shortly.
SOL is trading at $88.49 at press time.
 Dan Burgin
 U.Today Editorial Team