
Disclaimer: The opinions expressed by our writers are their own and do not represent the views of U.Today. The financial and market information provided on U.Today is intended for informational purposes only. U.Today is not liable for any financial losses incurred while trading cryptocurrencies. Conduct your own research by contacting financial experts before making any investment decisions. We believe that all content is accurate as of the date of publication, but certain offers mentioned may no longer be available.
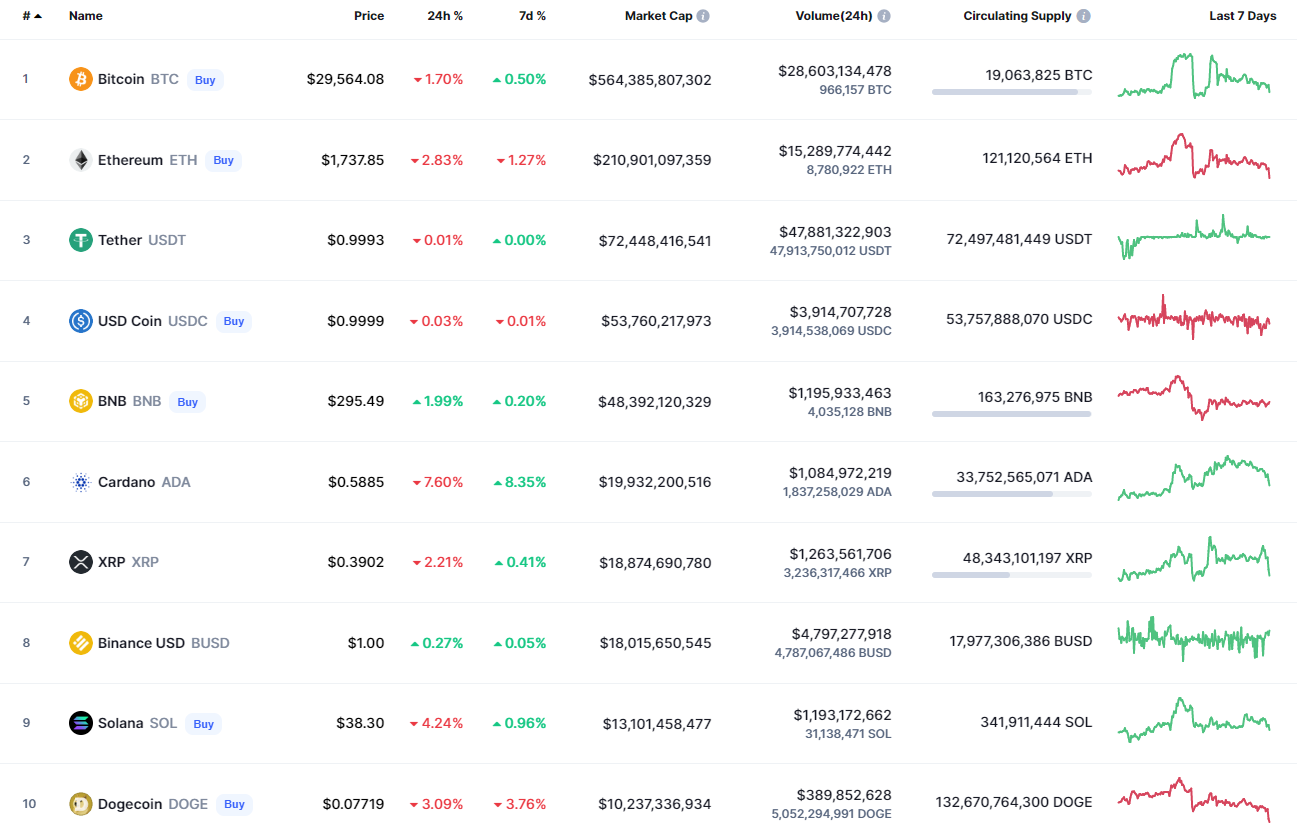
Bulls are struggling to recover their positions, with most of the top coins remaining in the red zone.
BTC/USD
Bitcoin (BTC) has broken the $30,000 mark, falling by 1.82% over the last day.
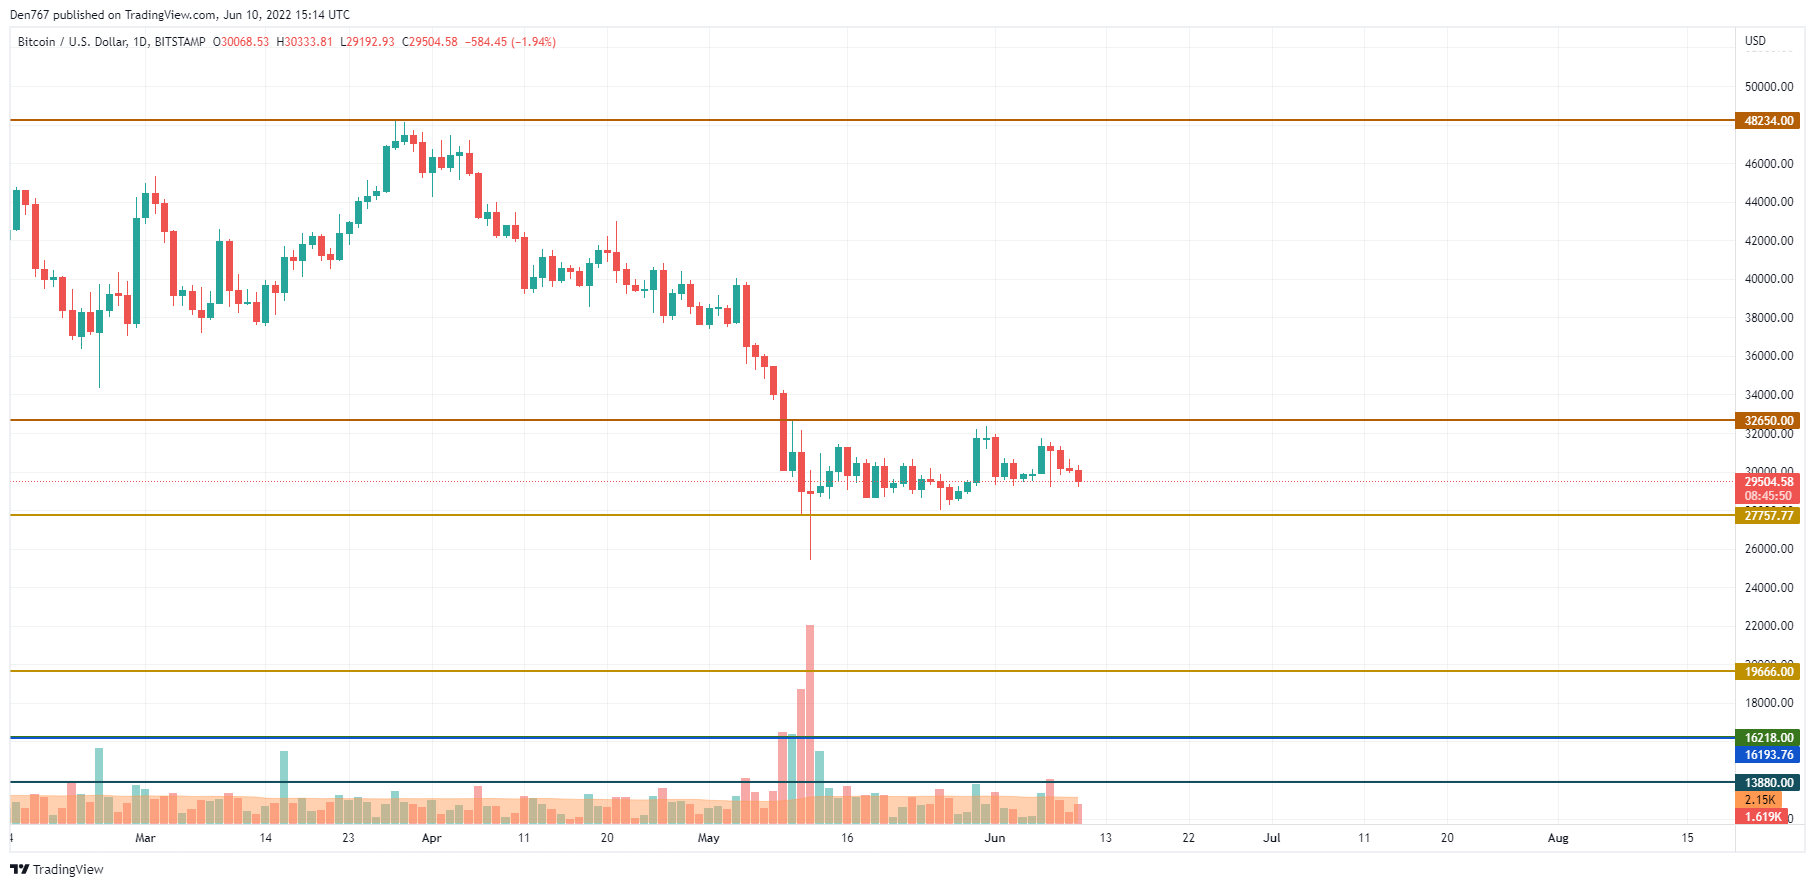
Bitcoin (BTC) is again below $30,000 as bulls didn't manage to maintain momentum and make a push toward the $31,000 zone. However, at the moment, one needs to pay close attention to where the daily candle closes.

If buyers cannot come back to the $30,000 price level, there is a high probability of testing the $28,500 mark shortly.
Bitcoin is trading at $29,490 at press time.
ETH/USD
Ethereum (ETH) is the biggest loser from the list today, going down by 3.24%.
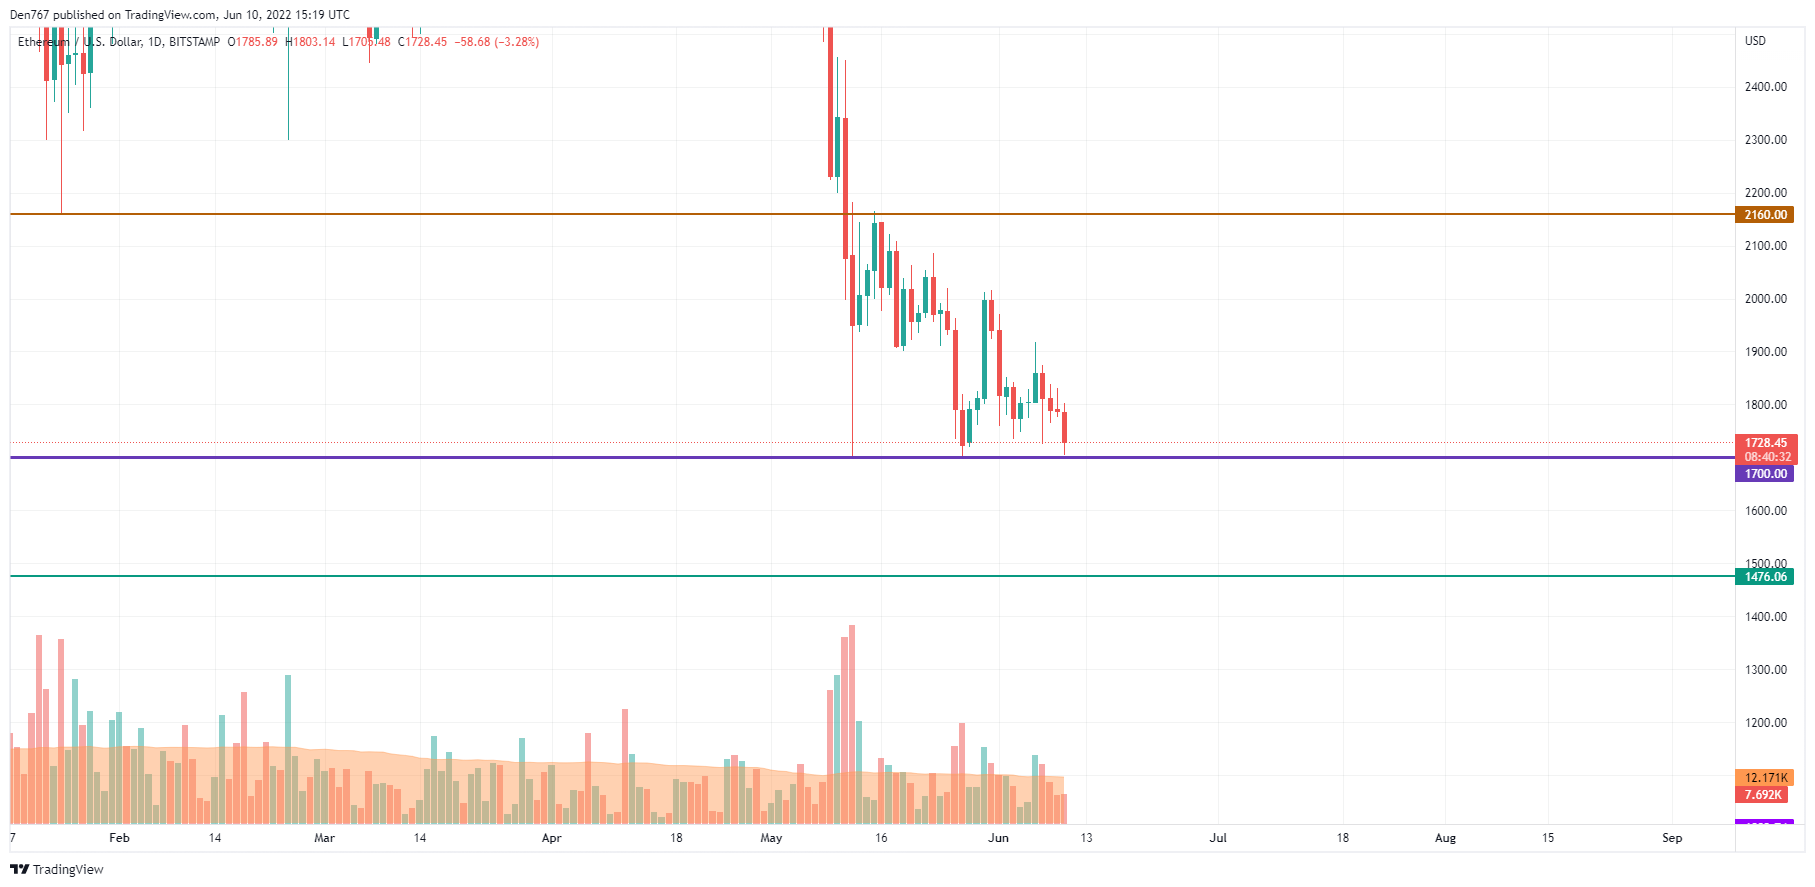
Ethereum (ETH) could not fix above $1,800, which means that bears are again more powerful than bulls. In addition, selling volume is high, confirming bears' pressure. If the situation does not change, Ether may drop below the $1,700 support level. If that happens, it can lead to the test of the zone around $1,500 within a few days.
Ethereum is trading at $1,732 at press time.
XRP/USD
XRP has followed the drop of top coins, losing 2.44% of its price share since yesterday.
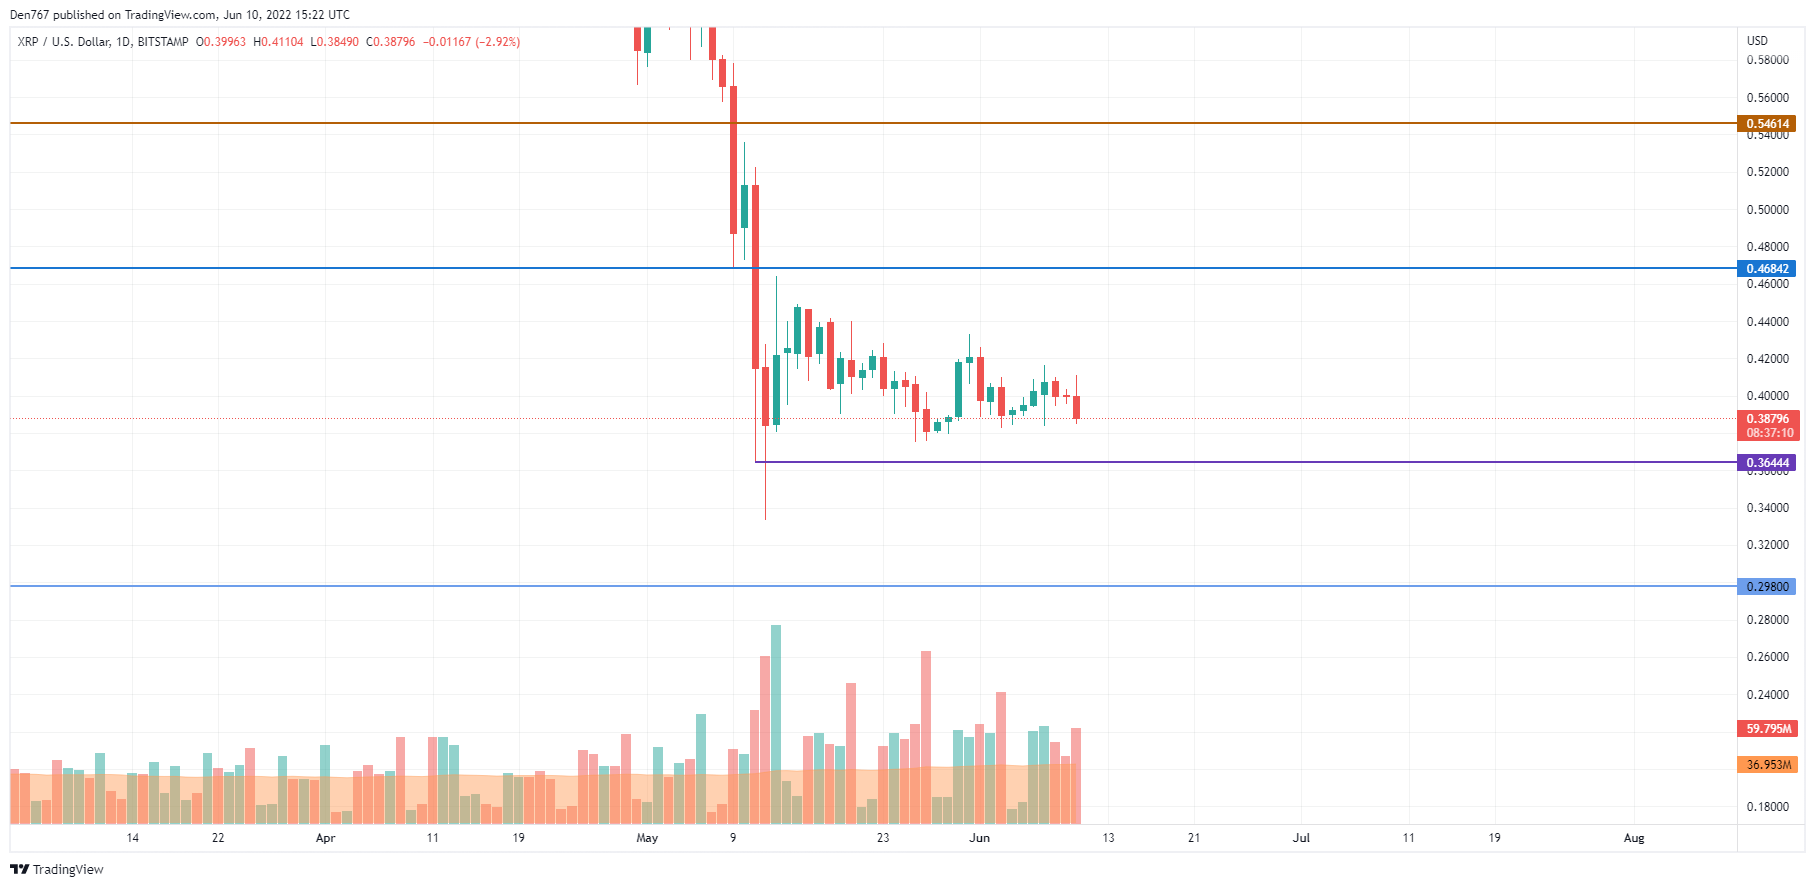
XRP is also below its crucial mark of $0.40. The selling volume is increasing, which means one is likely to see a continued price decrease. Respectively, the closest level where buyers can seize the opportunity is the support level at $0.3644.
XRP is trading at $0.38754 at press time.
 Dan Burgin
 U.Today Editorial Team