*** Please note the analysis below is not investment advice. The views and opinions expressed here are solely those of the author and do not necessarily reflect the views of U.Today. Every investment and trading move involves risk, you should conduct your own research when making a decision.
Bitcoin approaching the targets
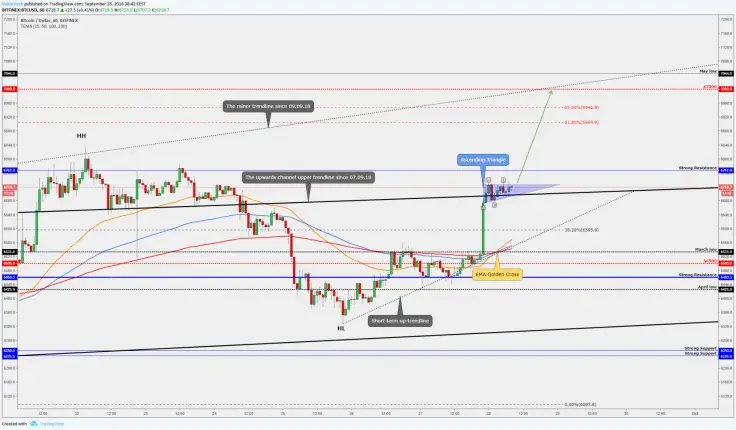
After we mentioned the neckline double retest on yesterday's post, BTC made a very strong move upwards. It breaks above the well-known resistance levels and more than that, now we are above the trendline which is the upper channel trendline and the current price is $6,720. Bitcoin reaches almost to our mentioned first target at $6,767 which is also historically a very strong resistance level.

On the one-hour chart, we have a golden cross between the EMA's and it should be a pretty good statement. Further, we have to wait and watch how the "Ascending Triangle" plays out. The ascending triangle is a bullish chart pattern which indicates that the price has a bigger advantage to break upwards, plus we have this golden cross which should support that move upwards to the higher levels and those higher levels are, almost immediately the $6,767 strong resistance and our major target would be the $7,000. There are several price action criteria crossing areas: the round number $7,000 and the minor trendline crossing area and there is the May low level which also starts to work as a resistance, but firstly we have to see a break above the ascending triangle and break above the strong resistance.
If BTC price doesn't find that power to go upwards and it breaks below the ascending triangle and breaks below the current trendline, then it will be a sign that we might see a little throwback (move downwards). If we start to make a little throwback then technically a good opportunity for reversal would be around $6,570, there is the short-term up-trendline, different EMA's starts to work as the support and different Fibonacci levels begin to work support levels. The bearish sign/confirmation would be the break below the short-term up-trendline.
Litecoin (LTC/USD)- on the upwards channel & the possible targets
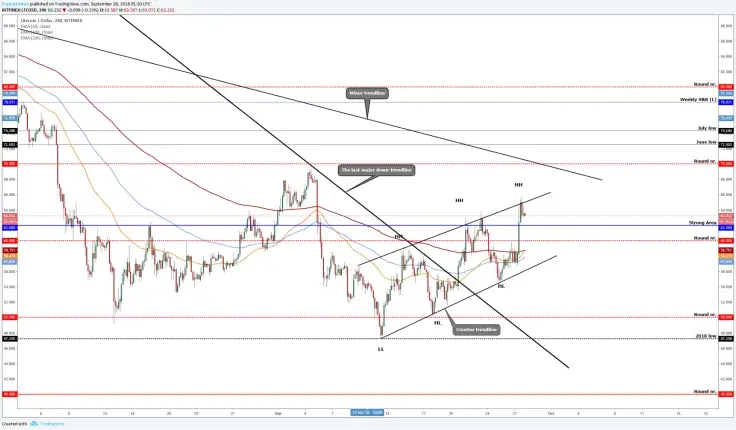
Litecoin is flying after the third touch from the major counter trendline! If we watch the top 10 altcoins, then LTC was one of the top gainers yesterday.

Currently, LTC price is on the upwards channel with very nice and clean higher highs and higher lows. It broke above the round number $60 and above the blue line which was a resistance. If we start to make a move downwards, then those levels become the supports.
Speaking of further resistances, then there is the minor trendline and the round number $70 at the crossing area. As you already know those crossing areas are always harder to beat and we have to watch it closely.
Above $70 we have the strong levels with very low gaps. In this area we have several monthly lows and even weekly supports and resistances, so, if the rally continues then, those areas are on the target list. But first, we have to break above this channel upper trendline which currently works as a resistance.
NEO (NEO/USD)- breaks above the triangle/needs more than that
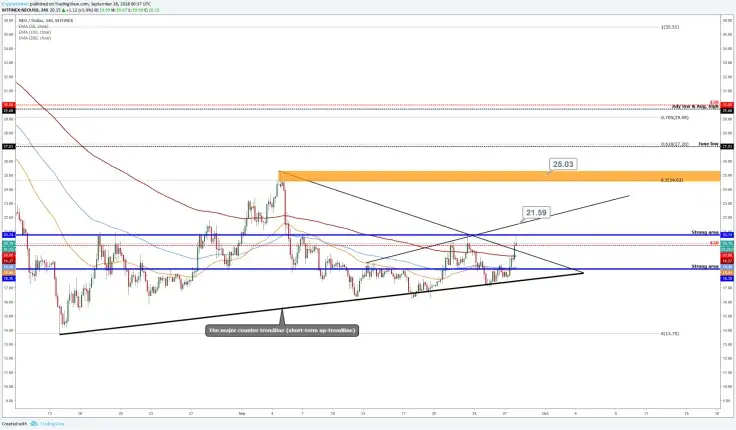
NEO has started to show a pretty bullish price action, it has a breakout from the triangle upper trendline and currently, it attempts to do a breakout above the round number $20. NEO has left behind the EMA's, plus 50 and 100 EMA's starts to make a golden gross which will indicate that the bull run may continue, but currently we have to fight with the strong resistance level.

Since Sept. 6 it has tried to break this two times and now is the third attempt. If it finds that power to push through (if BTC manages to push through $6,767 then NEO will definitely make the same move and will break above $20.7), then the next and the minor short-term target would be around $21.5 where the trendline is (a bit sloppy but still remarkable). The next target is around $25. There lies the last bigger resistance area and the Fibonacci retracement 50 percent. From the price structure perspective, this is also a critical level, because if NEO manages to break above that resistance, then we have a higher high, so this is a pretty significant level that you have to watch.
Bearish confirmations would be that if we lose the momentum and it can't break above the $20, plus if it drops back below the triangle. This shows that NEO tries to make breakouts but can't find that power and can't catch those buyers who want to buy higher prices.
 Dan Burgin
 Denys Serhiichuk
 Gamza Khanzadaev
 Caroline Amosun
 Tomiwabold Olajide