Disclaimer: The opinions expressed by our writers are their own and do not represent the views of U.Today. The financial and market information provided on U.Today is intended for informational purposes only. U.Today is not liable for any financial losses incurred while trading cryptocurrencies. Conduct your own research by contacting financial experts before making any investment decisions. We believe that all content is accurate as of the date of publication, but certain offers mentioned may no longer be available.
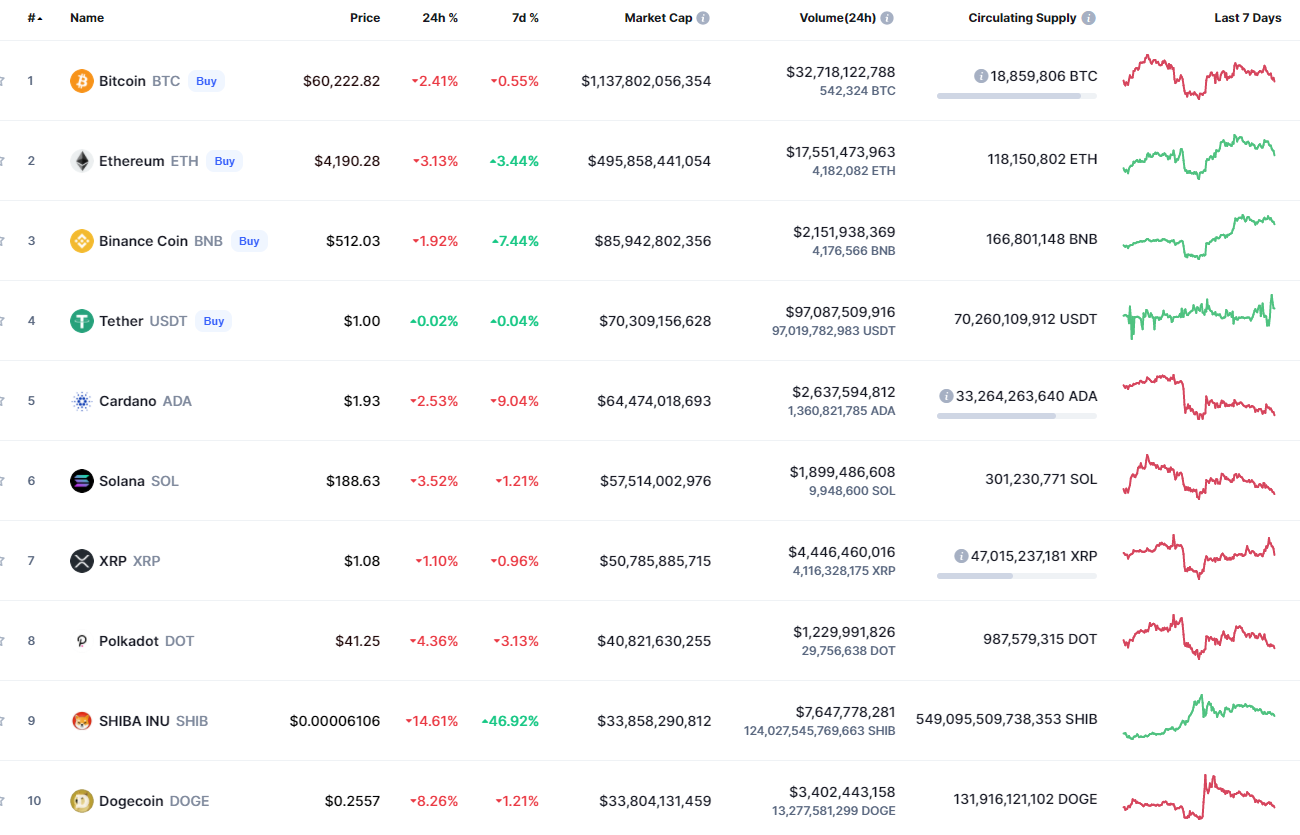
Bulls may have started fixing their profit as all of the top 10 coins have entered the red zone on the last day of the week.
BTC/USD
The rate of Bitcoin (BTC) has gone down by 2% since yesterday while its price has remained the same over the past seven days.
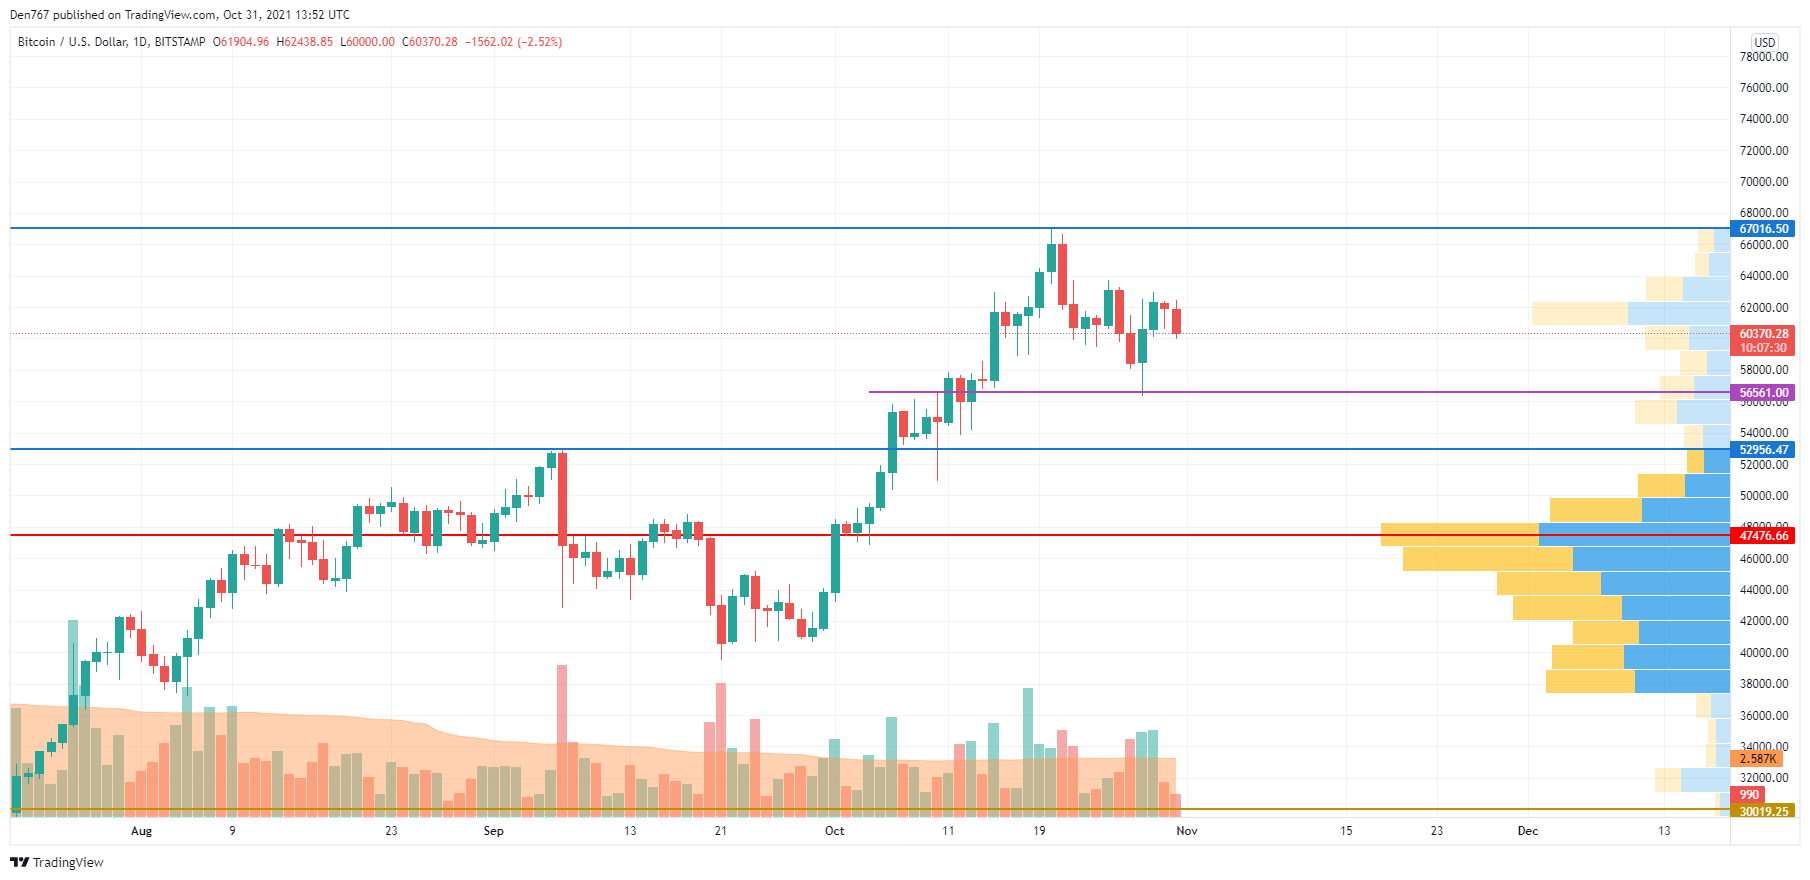
After a false breakout of the support at $56,560, Bitcoin (BTC) could not keep the rise and fixed above the $62,000 mark. Even though the selling trading volume is low, the decline may continue as buyers do not seem very interested in buying at the moment.
In this case, if bears break the support, the fall may lead BTC to $53,000 next week.
Bitcoin is trading at $60,390 at press time.
ADA/USD
Cardano (ADA) is the main loser from the list, declining by 2%.
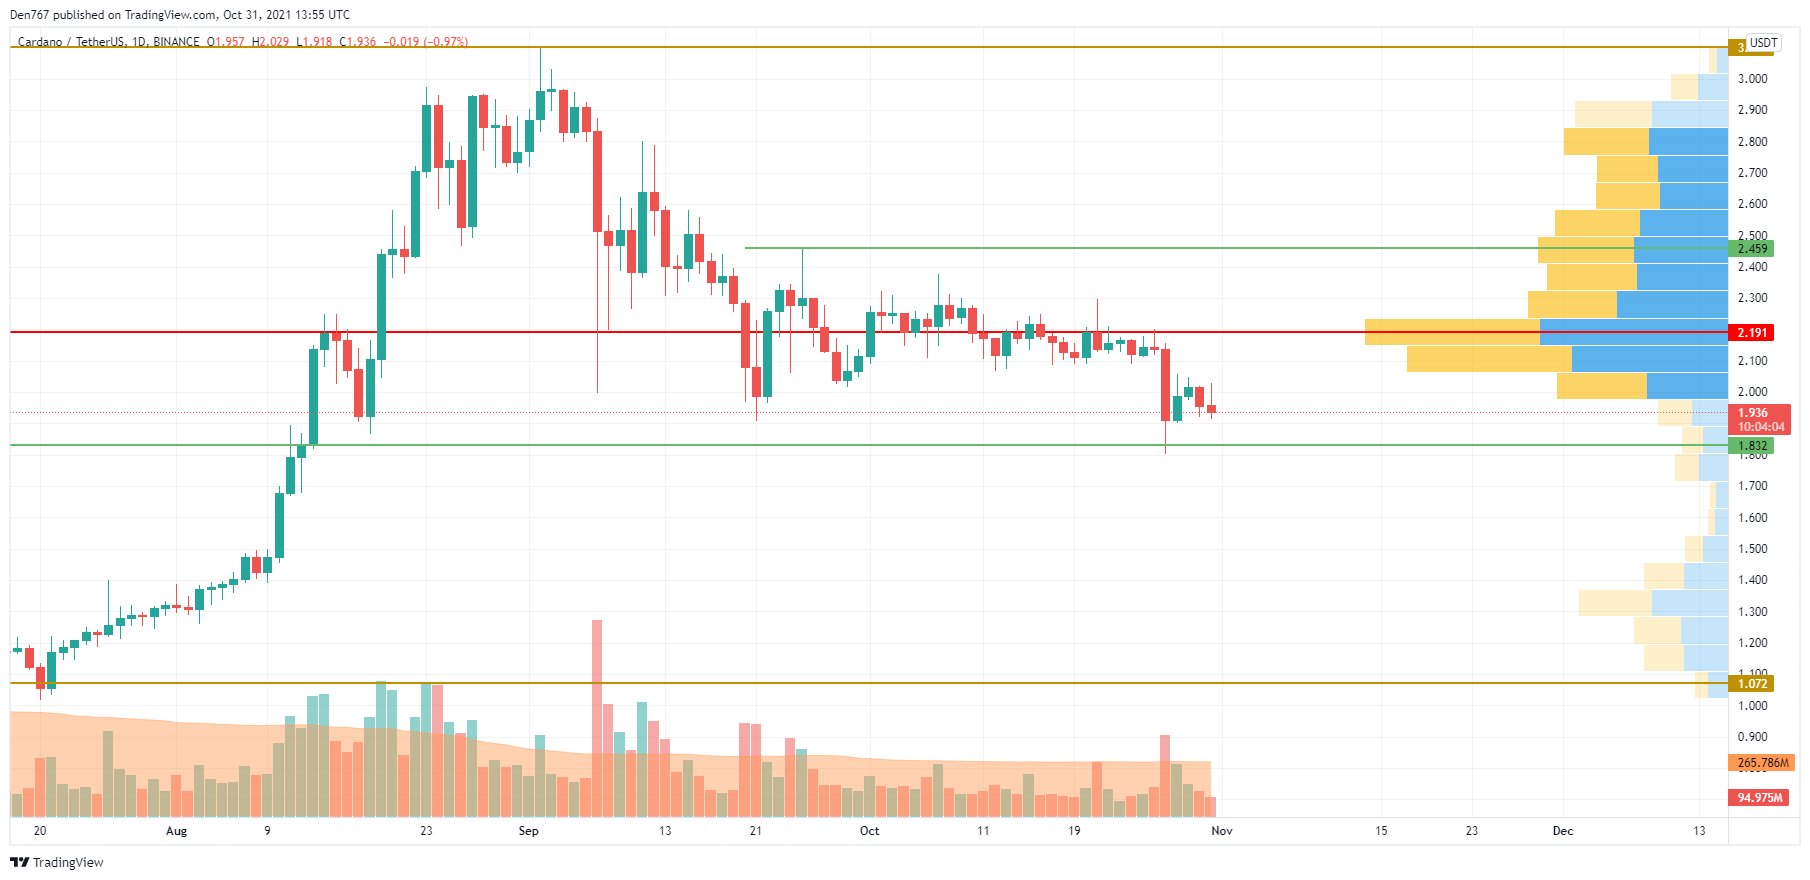
Cardano (ADA) is looking even worse than Bitcoin (BTC) as it is coming back to the support after a false breakout. Respectively, the breakout of $1.822 might be a huge bearish signal and get ADA back to $1.50 soon.
ADA is trading at $1.937 at press time.
BNB/USD
Despite today's decline, Binance Coin (BNB) has risen by 8% over the last week.
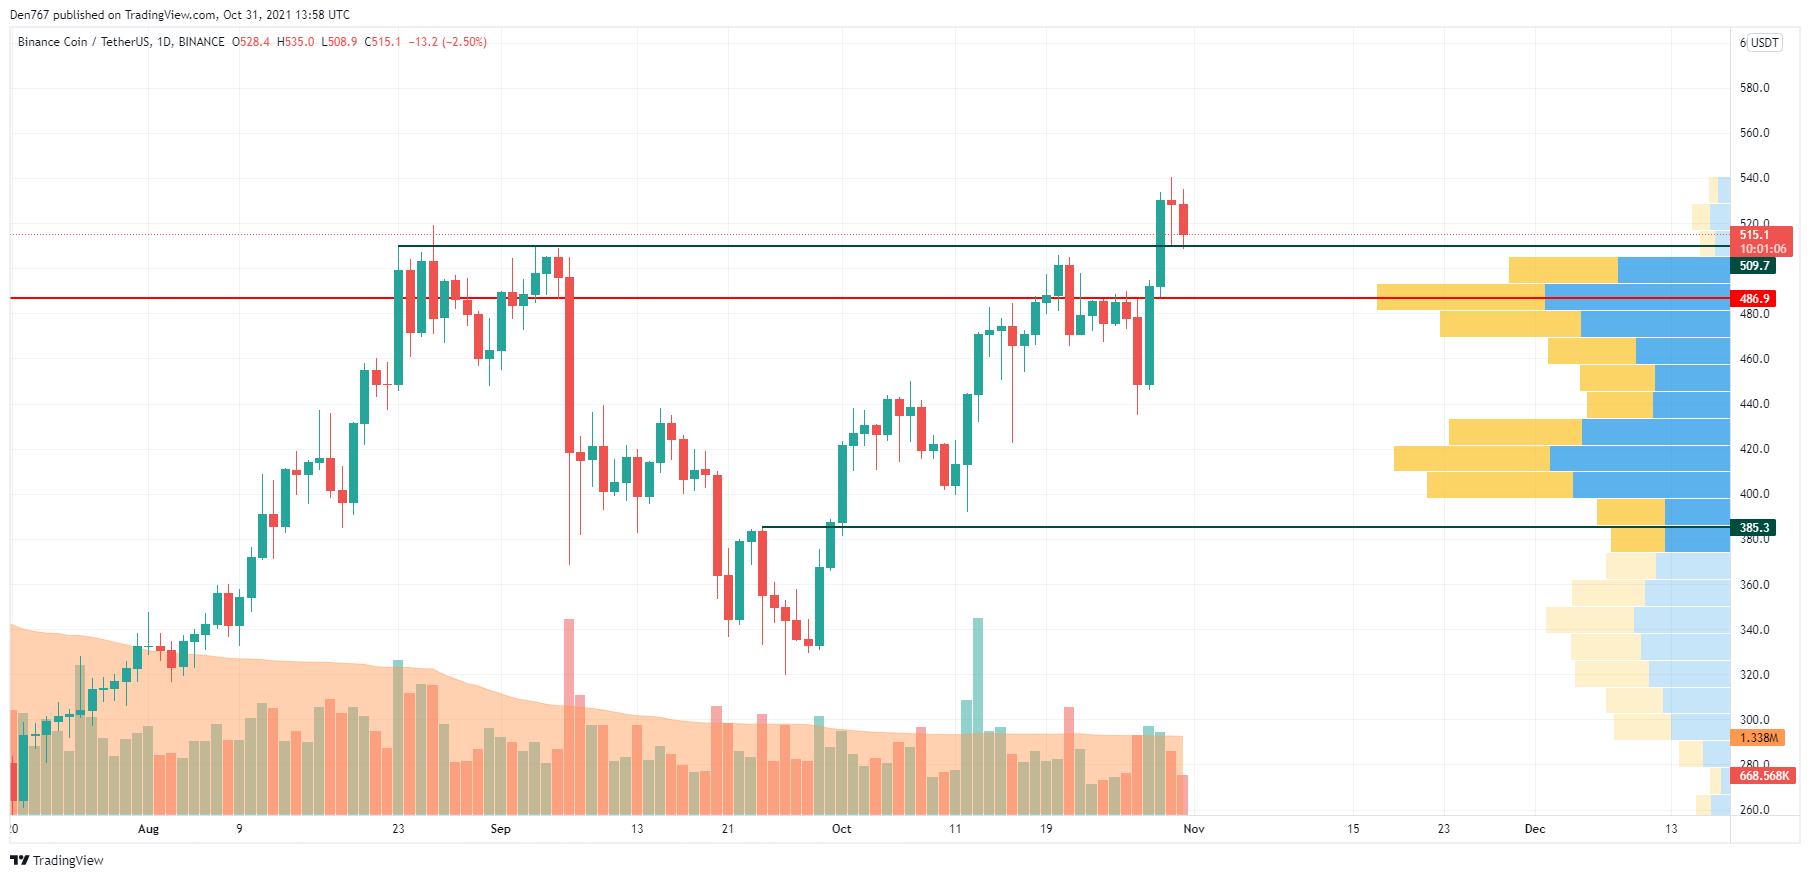
Binance Coin (BNB) is about to break the support at $509.70 as bulls are out of power to keep the rise going. In this regard, there is a high probability of seeing the continued decline of the native exchange coin to the area of the most liquidity around $487 soon.
BNB is trading at $513.40 at press time.
 Dan Burgin