Breaking its price targets one by one, Bitcoin Cash continues bringing traders profit and growing at a steady pace. With its price overcoming the $300 level, it is driving at full speed to $1,000. Is it possible? Read BCH price predictions from TradingView users to find out when BCH’s potential will be fully actualized.
BCH is to explode to $1,000
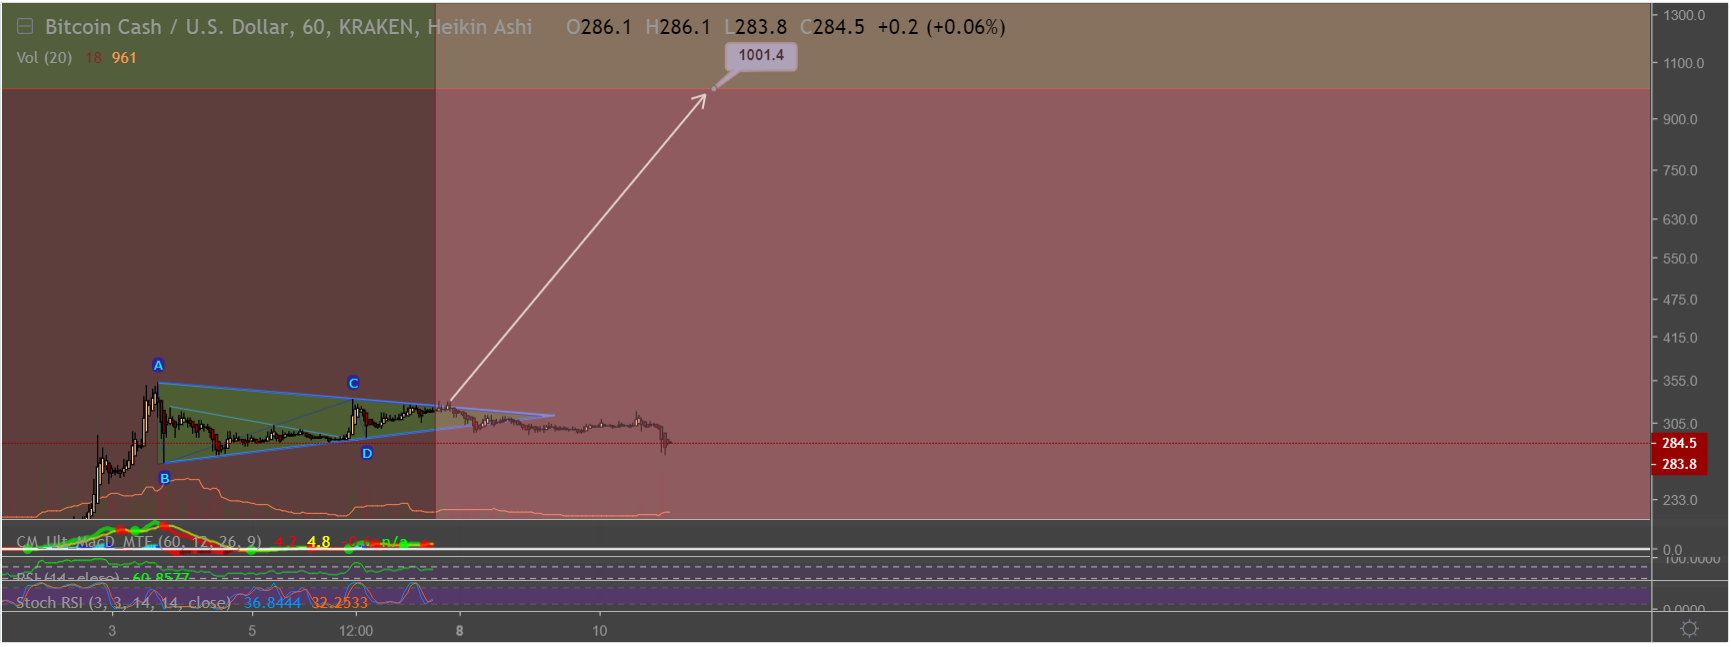
According to the BCH price prediction from CoinMajesty, we have a bullish pennant triangle pattern that’s about to explode upwards. Possible reward might be over 200%! How to reap maximum gains by entering the market now?
Buy BCH when it’s up to $320, the stop-loss is $290. In a few months, probably, by June-July, it might hit the $1,000 level. In this case, the Risk/Reward Ratio is 22.67. It’s the right time to get into the market even to reap lower profits because the current triangle looks very bullish.
It’s time to buy BCH SV!
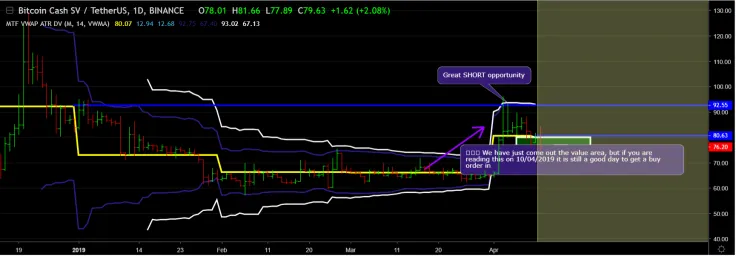
One more piece of proof that it’s high time to enter the market! According to the user Little_Big_Movement, BCH/USD looks very good, but the BCH SV/Tether pair is even more interesting. The user states there are debates between ABC and SV:
“I think that SV is true to the Bitcoin whitepaper which means in my personal opinion SV is Bitcoin Cash. Plus there is more opportunity to buy at the right value (VWAP) with BCH SV. As of writing, we are right on the VWAP level at $80.00, and before today we had entered into the value area (GREEN BOX). There is an exciting opportunity to buy BCH SV for cheap, and I would hold this buy order for at least a 15% rise in price to $92.00.”
With the current bullish trend, we will break the $92.00 price, but we should remember that BCH ABC & SV are correlated with the FAT overpriced older brother BTC. Once BTC starts moving again, both ABC and SV will begin to rise.
Little_Big_Movement warns users not to buy BTC because BCH ABC and SV have better underlying technology and though being underpriced, can soar in value sooner or later.
Technical insight
BCH in Depth Technical Analysis and trade journal. Week of 4/8/19
Trader Noxtreme has come with an in-depth analysis of BCH – it will give you a better understanding of what’s happening now to Bitcoin Cash.
BCH weekly RSI is at 50. This is lower than LTC (68) and BTC (57), but it means that BCH has more room to run. This being said, BCH has made one of the largest moves of the top-5 market cap crypto. Compare: BCH - 108%, LTC - 65%, BTC - 32%, ETH - 29%. At the same time, since BCH has made such a great advancement, it has the biggest loss potential if the entire market declines or consolidates. RSI being the lowest on BCH says that it did not take as buying pressure to move this price and, probably, it would not take as much selling pressure to drop it either.
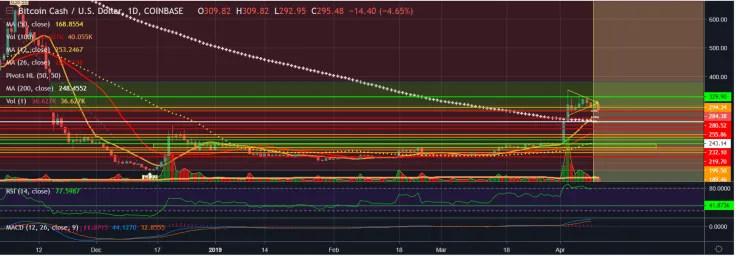
Now take a look at the green boxes on my chart. The big green box we are currently in is a price gap from the BCH/BSV contentious hard fork. Gaps tend to fill quickly in stocks.
The second smaller green box is where the extreme pullback potential is focused. This area has seen a lot of price actions so if we get a bear volume spike there is a chance we could come all the way back between $168.64 and $153, which is tough to even consider when looking at shorter term time frames and a current price.
Lastly, we have the 50 week MA coming down to greet us, potentially at the top of our price gap.
The user warns:
“BCH is a wild one. It is thinly traded and your risk reward is going to be greater. We are in somewhat uncharted territory price wise but RSI shows room to run on the weekly and we have less resistance than support at the current price level on most exchanges.”
On the BCH daily, there are more bullish signs then bearish. First one being 12MA, it is about to cross the 200MA and the price hit the 200, briefly consolidated, then pushed right through, creating a little support there (white line). Bears are looking at the RSI of 79. We also have a big symmetrical triangle bull flag. Volume is declining while the price is consolidating up. MacD shows bulls needing to slow down.
If we analyze the 4Hr BCH price chart, we see that the ranges between support and resistance lines are too huge. 17+ % from our current 294 support to the 200 MA cross support we see on my daily. 42% + to get down to our smaller green box and there are only (about 9) supports in that range.
RSI is 56 but BCH does not seem to like being less than 43 RSI on the 4hr since the end of January 19. We see the same swing characteristic here though; when it breaks, it really breaks.
Bitcoin Cash is a very tricky currency, and when trading it, you should take stops and analyze the situation properly. BCH tends to make unpredictable moves, but we’re sure that it should reach some unbelievable heights in the following 2-3 months. During this time, you’ll have a lot of opportunities to enter the market.
 Dan Burgin
 U.Today Editorial Team