Disclaimer: The opinions expressed by our writers are their own and do not represent the views of U.Today. The financial and market information provided on U.Today is intended for informational purposes only. U.Today is not liable for any financial losses incurred while trading cryptocurrencies. Conduct your own research by contacting financial experts before making any investment decisions. We believe that all content is accurate as of the date of publication, but certain offers mentioned may no longer be available.
Bitcoin (BTC) has emerged as the bellwether of digital assets, often serving as a leading indicator for the industry's trajectory. With the present cycle displaying a compelling mix of regulatory developments, macroeconomic factors and technical setups, a growing number of analysts are casting bullish predictions for the apex cryptocurrency.
A prominent narrative revolves around the historical price performance of Bitcoin following its cycle lows. In the cryptoverse, the adage "history doesn't repeat itself but it often rhymes" finds considerable traction. Analysts are quick to highlight a series of potentially bullish events on the horizon for Bitcoin. The potential approval of a Bitcoin ETF stands at the forefront of these events, promising to bridge the gap between traditional finance and the crypto domain.

Moreover, the upcoming Bitcoin halving in April, an event that slashes the reward for mining new blocks in half and effectively reduces the new supply of Bitcoin, has historically acted as a catalyst for significant price increases. The anticipation of this event tends to foster bullish sentiment as supply scarcity takes center stage.
Furthermore, indications that the Federal Reserve may be nearing the peak velocity of its rate hikes offer a glimmer of relief in an otherwise tight monetary policy environment. This shift could encourage risk-on behavior among investors, which traditionally benefits assets like Bitcoin.
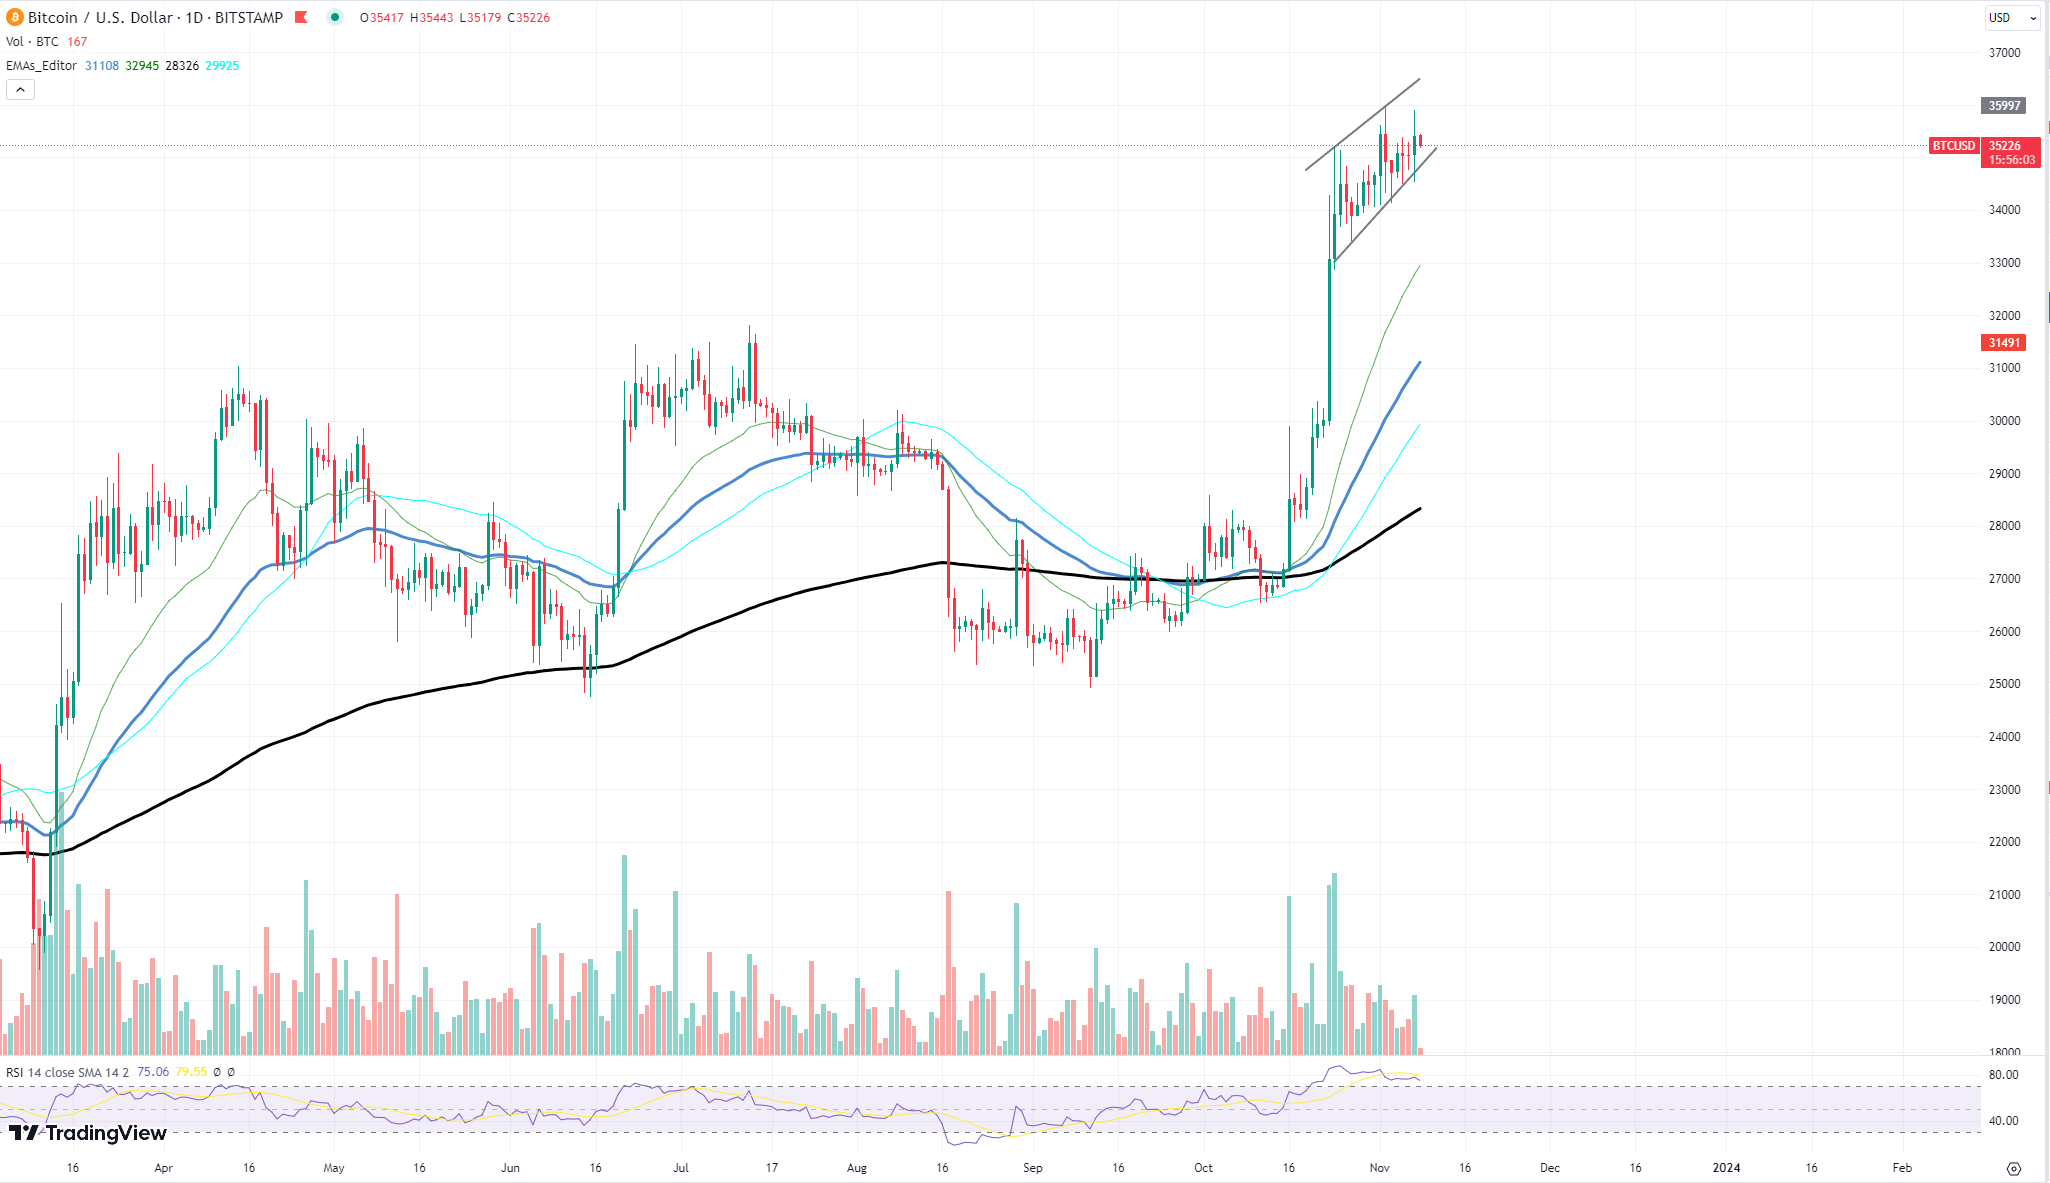
Turning to the technical analysis of Bitcoin's recent price action, the chart reveals a potential bull flag formation — an indication of a continuation pattern that often results in a breakout. The immediate local resistance is situated near the upper trendline of this flag pattern. A convincing break above this level could open the door to a retest of higher resistances.
Support levels, meanwhile, are etched into the recent lows from which Bitcoin rebounded, providing a safety net against potential downturns. These support zones will be crucial in maintaining the bullish structure of the current trend.

 Tomiwabold Olajide
 Arman Shirinyan
 Gamza Khanzadaev
 Yuri Molchan