
Disclaimer: The opinions expressed by our writers are their own and do not represent the views of U.Today. The financial and market information provided on U.Today is intended for informational purposes only. U.Today is not liable for any financial losses incurred while trading cryptocurrencies. Conduct your own research by contacting financial experts before making any investment decisions. We believe that all content is accurate as of the date of publication, but certain offers mentioned may no longer be available.
The cryptocurrency market continues to correct. On the Bitcoin (BTC) chart, there are already prerequisites for a continued decline, but as long as the support at $10,500 has not been broken, it is too early to talk about a strong fall. Cryptocurrencies like Litecoin (LTC) are showing growth signals. It is possible that the initial signal for Bitcoin correction will not be implemented, and the market will try to return to growth.
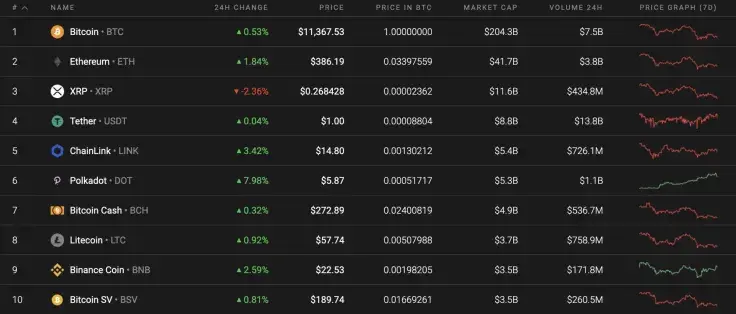
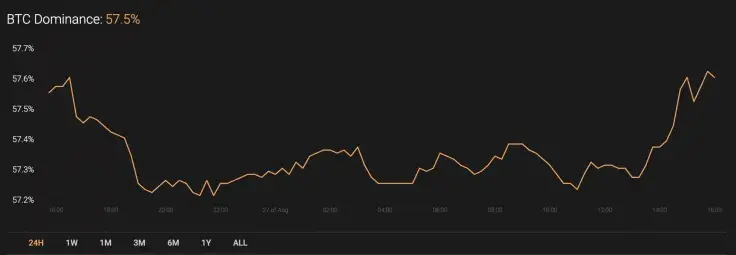
Meanwhile, the market share of the leading crypto is almost unchanged and currently sits at 57.5%.
The relevant Bitcoin data looks the following way:
-
Name: Bitcoin
Advertisement -
Ticker: BTC
-
Market Cap: $209,670,590,022
-
Price: $11,350.61
Advertisement -
Volume (24h): $21,681,171,911
-
Change (24h): 0.50%
The data is relevant at press time.
BTC/USD: Has the time to see Bitcoin below $11,000 arrived?
Yesterday, buyers did not manage to overcome the 50% Fibo resistance ($11,395) for a long time. In the second half of the day, they still managed to break through the fifty percent Fibonacci level and test the two-hour moving average EMA55.
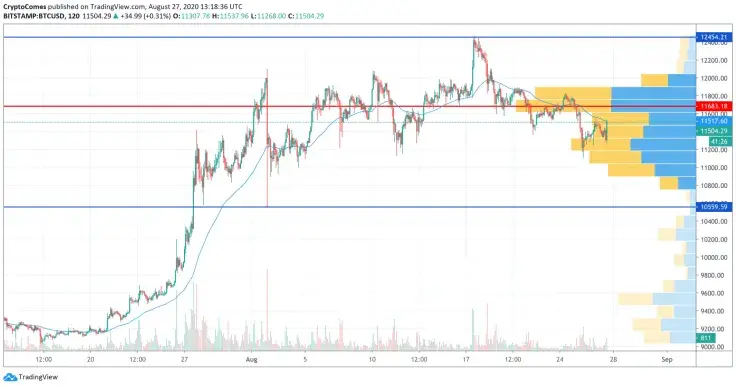
The breakout was not supported by large volumes. Therefore, as expected, the pair returned to the 50% Fibonacci level. If sellers push the price below the support of $11,200 this morning, then by evening the decline may stop near the blue trend line ($11,000). If buyers restore the pair above the average price level, then at the end of the day the Bitcoin (BTC) price will test the POC line ($11,740).
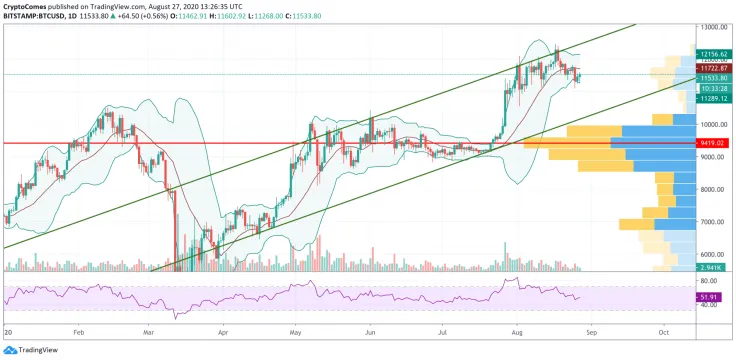
On the daily chart, Bitcoin (BTC) quotes continue to decline. The key support areas remain the levels of $11,240 and $11,535. The values of the RSI indicator have broken through the support line, which indicates the potential for a further price decline to $11,240.
Its breakdown with the consolidation of quotes below the lower border of the ascending channel will trigger a fall to $8,830. The main scenario should be considered a rebound from the lower boundary of the ascending channel and continued growth.
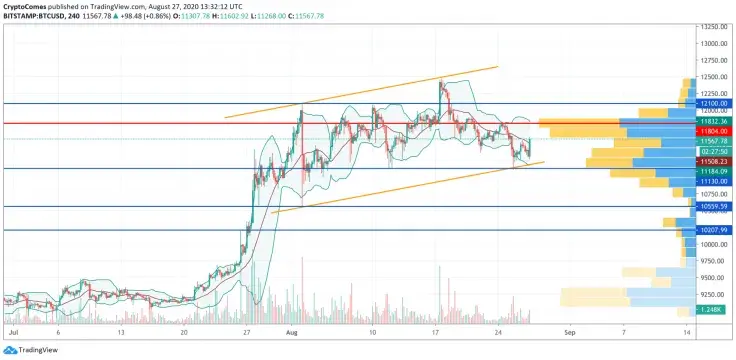
On the 4H chart, the price has broken the lower boundary of the ascending channel. Overcoming the support area with the consolidation of quotations below $11,110 will indicate a further decline. Its targets within the framework of working out the width of the broken channel can be $10,540 and lower. It is worth expecting a resumption of growth only with a breakdown of the level of $11,970, after which the price should return inside the channel and go beyond the nearest important resistance.
Bitcoin is trading at $11,561 at press time.
 Dan Burgin
 U.Today Editorial Team