
Disclaimer: The opinions expressed by our writers are their own and do not represent the views of U.Today. The financial and market information provided on U.Today is intended for informational purposes only. U.Today is not liable for any financial losses incurred while trading cryptocurrencies. Conduct your own research by contacting financial experts before making any investment decisions. We believe that all content is accurate as of the date of publication, but certain offers mentioned may no longer be available.
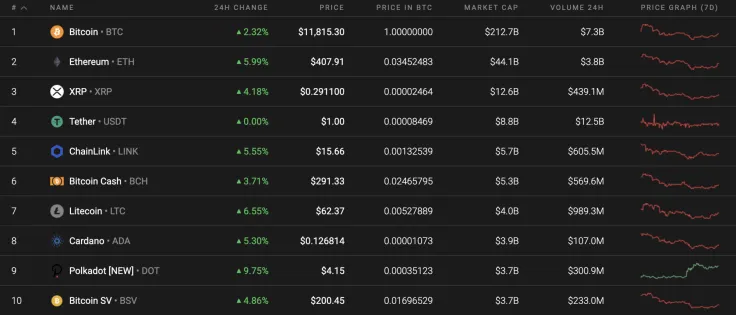
The new week has begun with the reverse of most of the coins. All Top 10 cryptocurrencies are in the green zone, while the top gainer is Polkadot (DOT), whose rate has risen by almost 10%.
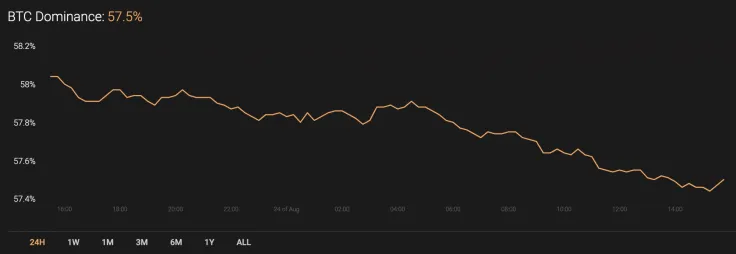
The sharp rise of altcoins has affected the dominance rate of the leading crypto, which has declined and is now at 57.5%.
The key Bitcoin data today:
-
Name: Bitcoin
Advertisement -
Ticker: BTC
-
Market Cap: $217,611,058,344
-
Price: $11,782.10
Advertisement -
Volume (24h): $20,920,678,878
-
Change (24h): 1.95%
The data is relevant at press time.
BTC/USD: Have bulls accumulated enough energy to update peaks?
Yesterday morning, Bitcoin (BTC) price consolidation in the mid-range area took too long and buyers were unable to break through the resistance of the two-hour EMA55.
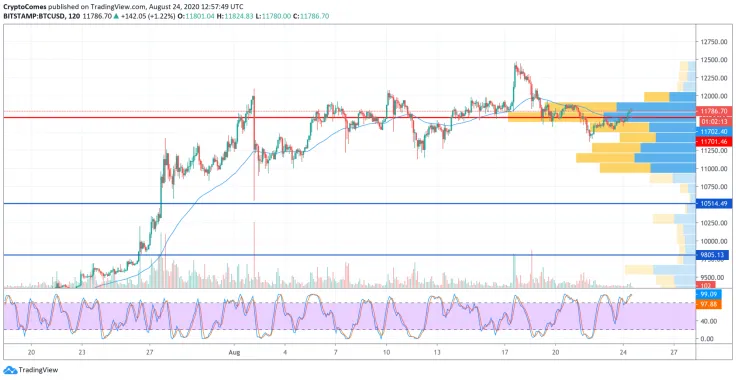
During the day, sellers pushed the pair below the POC line ($11,740), at night the pressure increased, and this morning the Bitcoin (BTC) price tested the 50% Fibo level ($11,394).
If the 50% Fibonacci level fails to cope with the support, then the next closest level that can still stop the bears is the $11,200 level. Its breakout may lead to the pair leaving the ascending channel, the lower border of which is the blue trend line. In this case, the price will roll back below the level of $10,500.
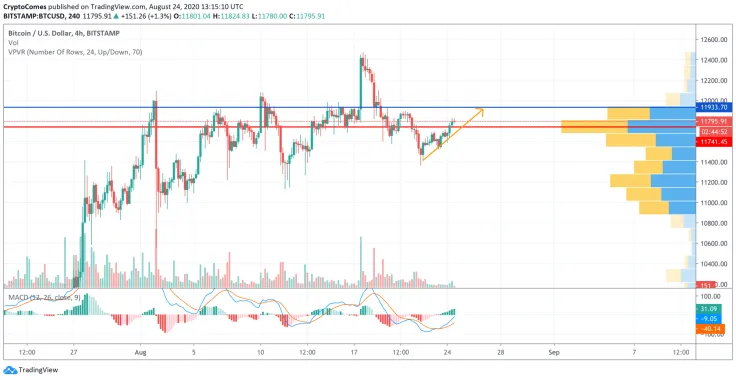
On the 4H time frame, Bitcoin (BTC) has entered a short-term bullish phase after it successfully bounced off the support at $11,400. The buying trading volume has also increased, which confirms the bulls' presence. Thus, the lines of the MACD indicator have changed to green. This means that bears have lost short-term initiative. In this case, the more likely scenario is a continued rise to the area of $11,900-$11,950 shortly.
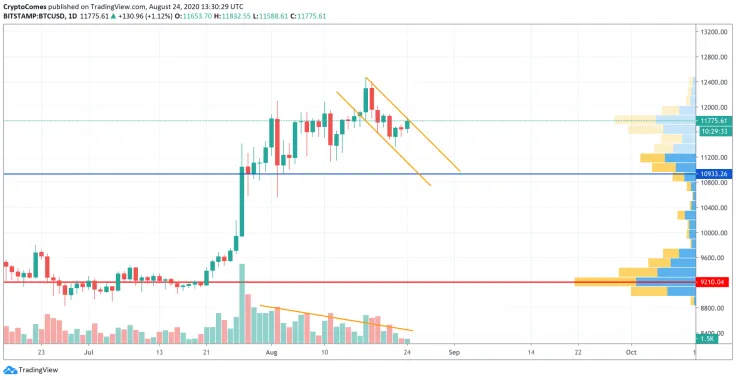
On the daily chart, the situation is not so positive. The trading volume keeps declining while the rate of Bitcoin (BTC) remains in the same price range. The liquidity level is also low which confirms the inability of bulls to continue the growth wave. All in all, if buyers cannot get to $12,000 soon, there is a high chance of seeing a drop to $11,000 by the end of the month.
Bitcoin is trading at $11,778 at press time.
 Gamza Khanzadaev
 Yuri Molchan
 Arman Shirinyan
 Alex Dovbnya