
Disclaimer: The opinions expressed by our writers are their own and do not represent the views of U.Today. The financial and market information provided on U.Today is intended for informational purposes only. U.Today is not liable for any financial losses incurred while trading cryptocurrencies. Conduct your own research by contacting financial experts before making any investment decisions. We believe that all content is accurate as of the date of publication, but certain offers mentioned may no longer be available.
Bitcoin took a massive hit after reaching the $71,000 threshold, losing 14% of its value and plummeting below $60,000. However, there is a realistic possibility of a reversal in the foreseeable future as BTC has reached the lower threshold of the sideways market channel.
First of all, BTC's price action indicates a significant buying zone at $58,000, a level of historical support. The 200-day moving average, or the black line on the chart, and this support level imply that a Bitcoin rebound may be imminent.
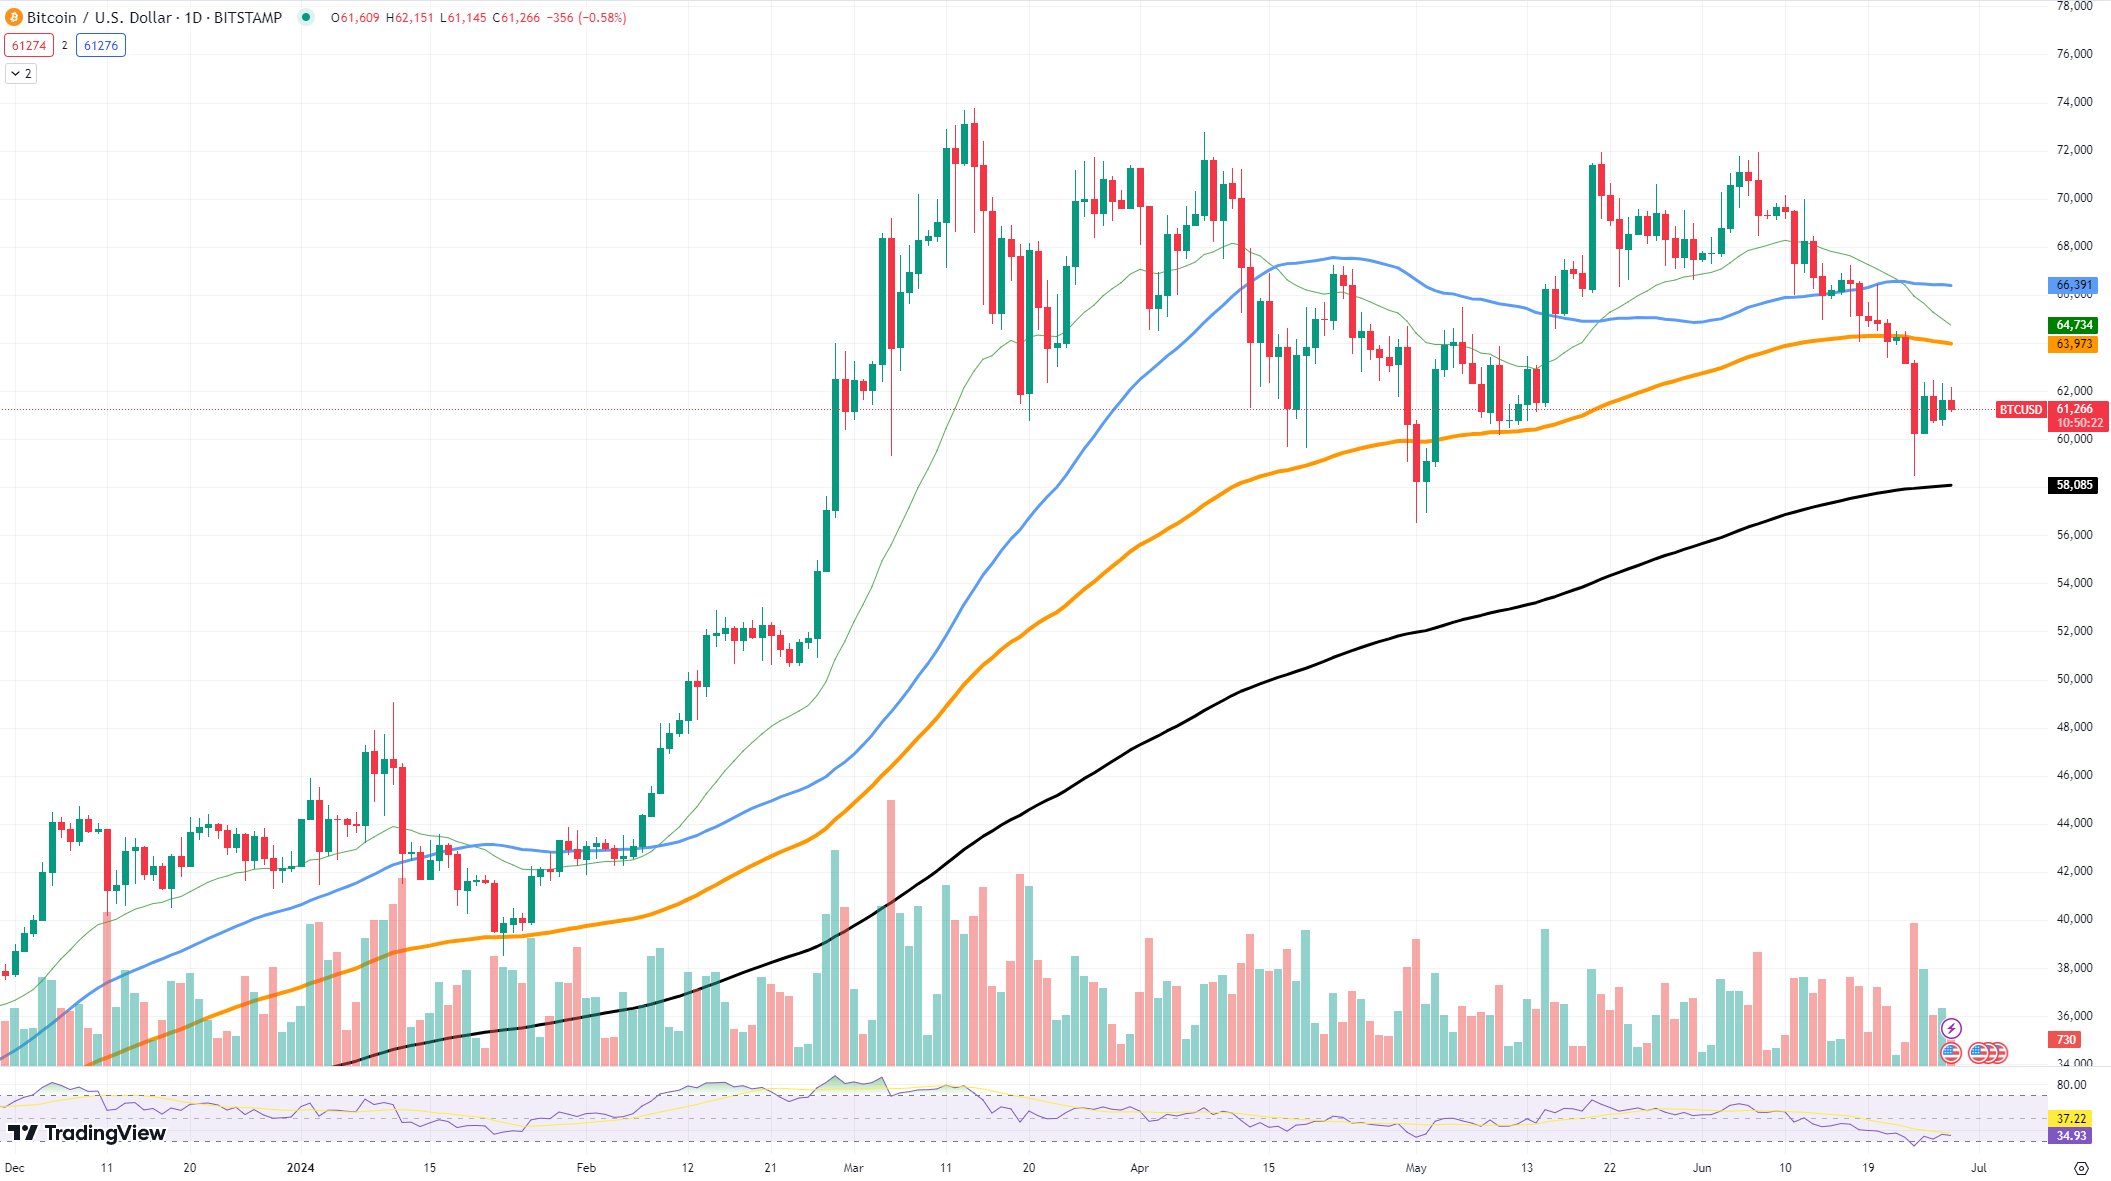
The volume profile shows more encouraging signs. Due to the recent drop, trading volumes have increased, suggesting that buyers are still very interested in the product at these reduced prices. Heightened activity typically signals an impending price reversal because it is an accumulation by investors anticipating gains in the future. Moving averages offer an additional level of understanding.
Though these levels frequently serve as dynamic support and resistance zones, the chart indicates that Bitcoin is currently trading below the 100-day and 50-day exponential moving averages. A break above these moving averages on Bitcoin suggest a possible trend reversal and a move in the direction of bullish momentum.
For now, there is no distinctive fuel for the asset, and it is unlikely to appear in the foreseeable future, unless the Ethereum ETF pushes the market forward as a whole.
XRP gets ready
XRP is in the process of making another reversal attempt to break the descending trend that came after the prolonged sideways trend. We are aiming for the breakthrough of the 26 EMA and substantial stabilization and reversal. However, momentum is what is really needed right now.
The chart indicates that XRP has had difficulty keeping up its upward momentum and has continued failing to breach significant resistance levels. To suggest a possible trend reversal, XRP must cross above the 26-day Exponential Moving Average (EMA). This level has served as a barrier, and a successful breach might herald the start of a bullish phase.

The volume analysis reveals that traders have differing opinions, though. Trading volume has occasionally spiked but not consistently enough to allow for a long-term upward trend. Significantly higher buying volume is necessary for XRP to maintain its reversal attempt. This would give the market the momentum it needs to break through resistance levels and keep prices higher.
XRP is presently in the neutral zone, according to the Relative Strength Index (RSI). There is potential for upward movement because this shows neither overbought nor oversold conditions.
Dogecoin aims higher
Dogecoin is going to test the $0.13 price threshold in the next few days, suggesting the current market composition. We are most likely going to see a test of the 200 EMA threshold and a subsequent breakthrough, if there is enough momentum.
The 200-day Exponential Moving Average (EMA) is represented by the $0.13 mark on the chart, which indicates that Dogecoin has been finding it difficult to break above significant resistance levels.

A successful break above this level, which has historically been a major resistance point, might signal a bullish reversal. There may be cause for concern as volume analysis indicates that trading activity has been relatively muted. Dogecoin requires a sizable rise in purchasing volume to continue its upward trend.
The momentum needed to convincingly break through the 200 EMA may be hampered by a lack of consistently high trading volumes. The relative positions of the 100-day and 50-day EMAs are also noteworthy. At the moment, Dogecoin is trading below both of these moving averages, which typically denotes a downward trend.
But DOGE would be a very bullish indicator if it could muster enough buying pressure to break through these levels. Some additional information is offered by the Relative Strength Index (RSI).
The fact that Dogecoin's RSI is currently circling the neutral zone indicates that there is still potential for upward movement without an overbuying situation. A move above the RSI's 50-point threshold would boost confidence in a possible bullish breakout.
 Dan Burgin
 U.Today Editorial Team