
Disclaimer: The opinions expressed by our writers are their own and do not represent the views of U.Today. The financial and market information provided on U.Today is intended for informational purposes only. U.Today is not liable for any financial losses incurred while trading cryptocurrencies. Conduct your own research by contacting financial experts before making any investment decisions. We believe that all content is accurate as of the date of publication, but certain offers mentioned may no longer be available.
Bitcoin is currently hovering over a significant support level. The Global In/Out of the Money chart, a metric used to assess the distribution of Bitcoin held at various profit and loss positions, suggests that a substantial support level is currently in place around the $42,000 price level.
The indicator works by analyzing the price at which the current addresses acquired Bitcoin and comparing it to the current price. This provides a clear visualization of the amount of supply that is "in the money" (profitable) or "out of the money" (unprofitable). According to this indicator, a vast majority of Bitcoin addresses are currently in a state of profit, which typically translates to a strong support level as fewer investors are likely to sell at a loss.
However, while the indicator provides valuable insights, it is not the sole determinant of Bitcoin's support and resistance levels. Traditional technical analysis on the BTC/USDT chart also plays a crucial role in defining potential movement scenarios.
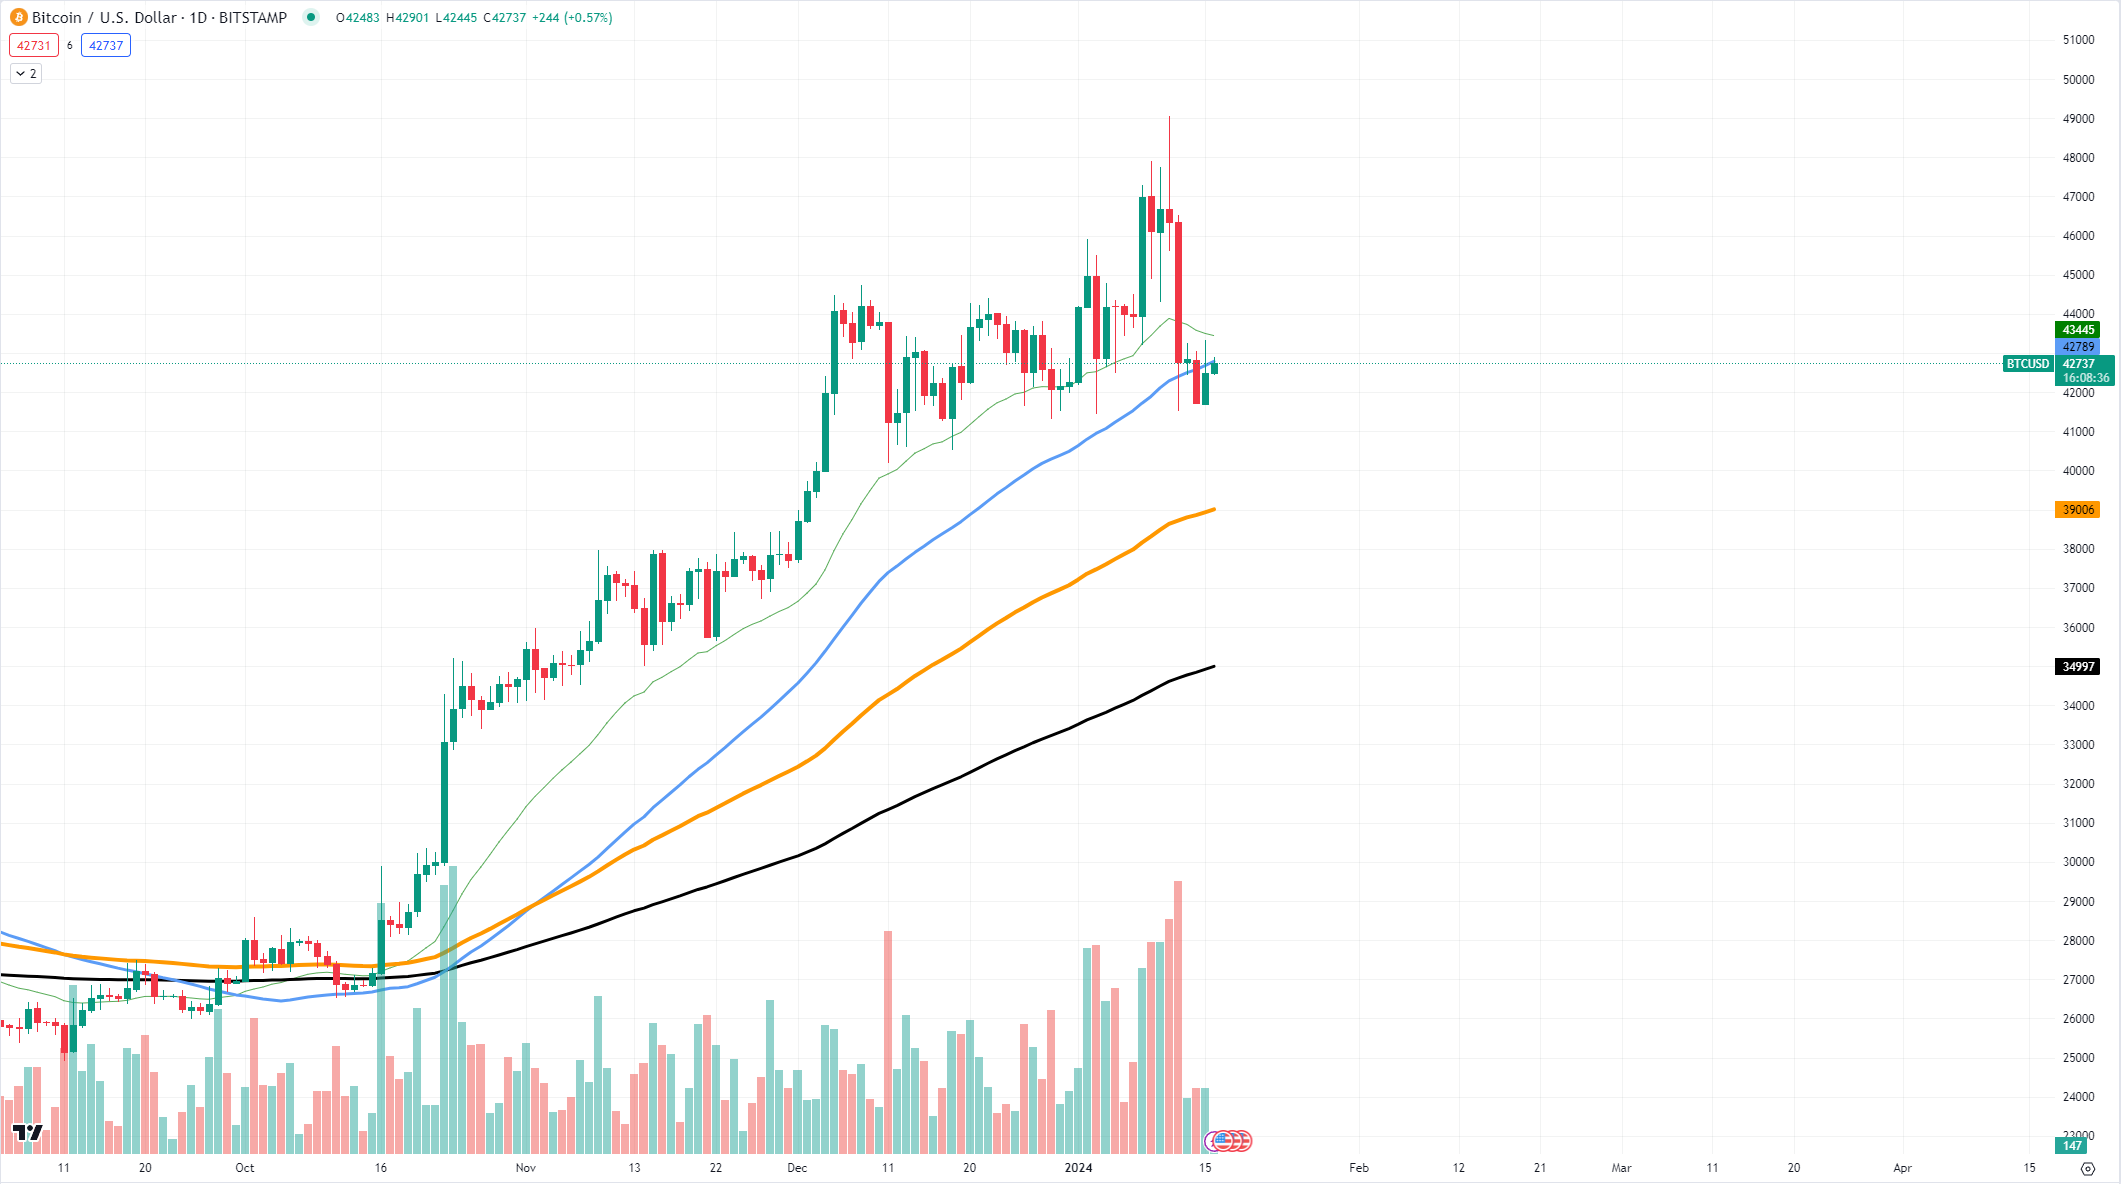
From a technical standpoint, Bitcoin has been testing the resilience of the 50-day EMA, a widely watched level by traders for bullish or bearish confirmations. A sustained position above this line is often seen as a bullish signal, while a drop below could indicate a bearish trend.

Looking forward, the key resistance to watch is the recent high, where Bitcoin faced considerable selling pressure. If Bitcoin sustains its current levels and rebounds upward, it would need to break past this resistance to confirm a bullish continuation. Conversely, if the price were to fall below the 50-day EMA, the next critical support lies at the 200-day EMA, a level that has historically been a strong buy zone for long-term investors.
The confluence of the GIOM indicator and traditional technical analysis paints a detailed picture of Bitcoin's current market position. The robust $42 trillion support level indicated by the IntoTheBlock's indicator suggests a strong foundation, where a significant portion of investors are holding onto their assets, providing some psychologically important price stability.
 Dan Burgin
 U.Today Editorial Team