Disclaimer: The opinions expressed by our writers are their own and do not represent the views of U.Today. The financial and market information provided on U.Today is intended for informational purposes only. U.Today is not liable for any financial losses incurred while trading cryptocurrencies. Conduct your own research by contacting financial experts before making any investment decisions. We believe that all content is accurate as of the date of publication, but certain offers mentioned may no longer be available.
Bitcoin has a history of making extremely volatile moves after entering a period of consolidation. History shows that BTC had a quarterly close pivot after every single consolidation phase.
Based on the chart that displays the quarterly price movement of Bitcoin since 2010, it is evident that significant price fluctuations usually occur after periods of consolidation. Following some relative stability, Bitcoin saw a huge increase in value at the beginning of 2013 — it went from about $16 to $739 in a matter of quarters.
In 2015 and 2017 occurred a similar pattern of consolidation around $230, followed by a spike to almost $20,000 by the end of 2017. Prior to soaring to over $60,000 in early 2021, Bitcoin more recently stabilized around the $10,000 mark in late 2020. As we observe Bitcoin currently trading at $58,000, following yet another phase of consolidation, past patterns point to the possibility of another spike.
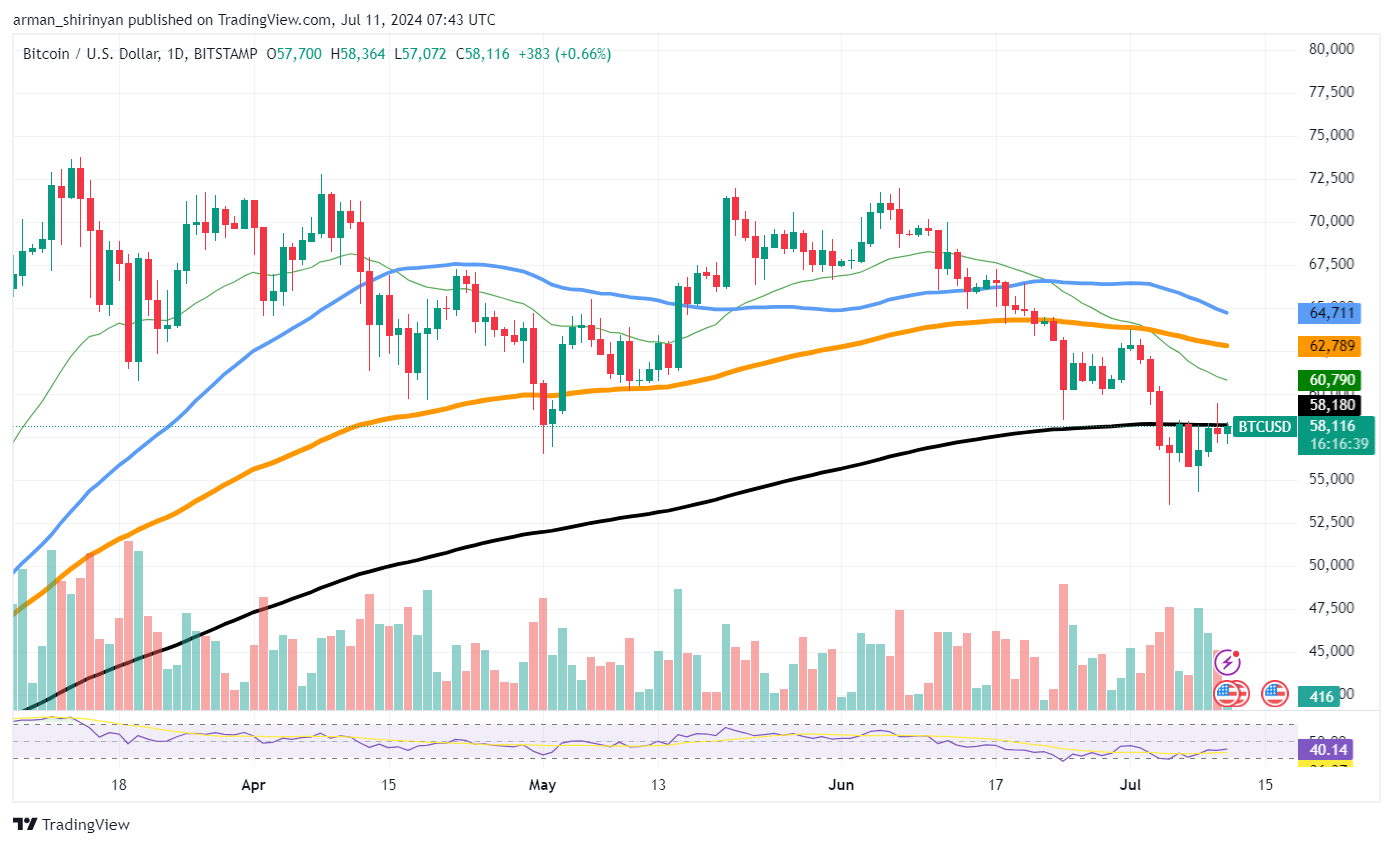
With an emphasis on the previous few months, the second chart offers a closer look at Bitcoin's daily price fluctuations. The exponential moving averages (EMAs) 50, 100 and 200 are displayed on this chart. Recently, the price of Bitcoin found support at the 200 EMA, suggesting that a bottom may be forming.

Given that Bitcoin is now trading above the 100 EMA, the recent rebound from this level suggests a bullish outlook. The daily chart also shows that the volume decreased during the downtrend and increased as the price started to rise. This volume pattern frequently shows the start of a fresh upward trend and the conclusion of a bearish phase. Based on the two charts' past quarterly fluctuations and current daily activity, it appears that Bitcoin is ready for yet another big move.
 Dan Burgin
 U.Today Editorial Team