
Disclaimer: The opinions expressed by our writers are their own and do not represent the views of U.Today. The financial and market information provided on U.Today is intended for informational purposes only. U.Today is not liable for any financial losses incurred while trading cryptocurrencies. Conduct your own research by contacting financial experts before making any investment decisions. We believe that all content is accurate as of the date of publication, but certain offers mentioned may no longer be available.
Bitcoin has been on a meteoric rise, shattering previous all-time highs and cementing its status as the apex cryptocurrency. However, a closer look at the technicals suggests we may be approaching a juncture where the momentum could stall, potentially leading to a stalemate. Here are three reasons that might cause the Bitcoin/USDT chart to enter a period of consolidation around current levels.
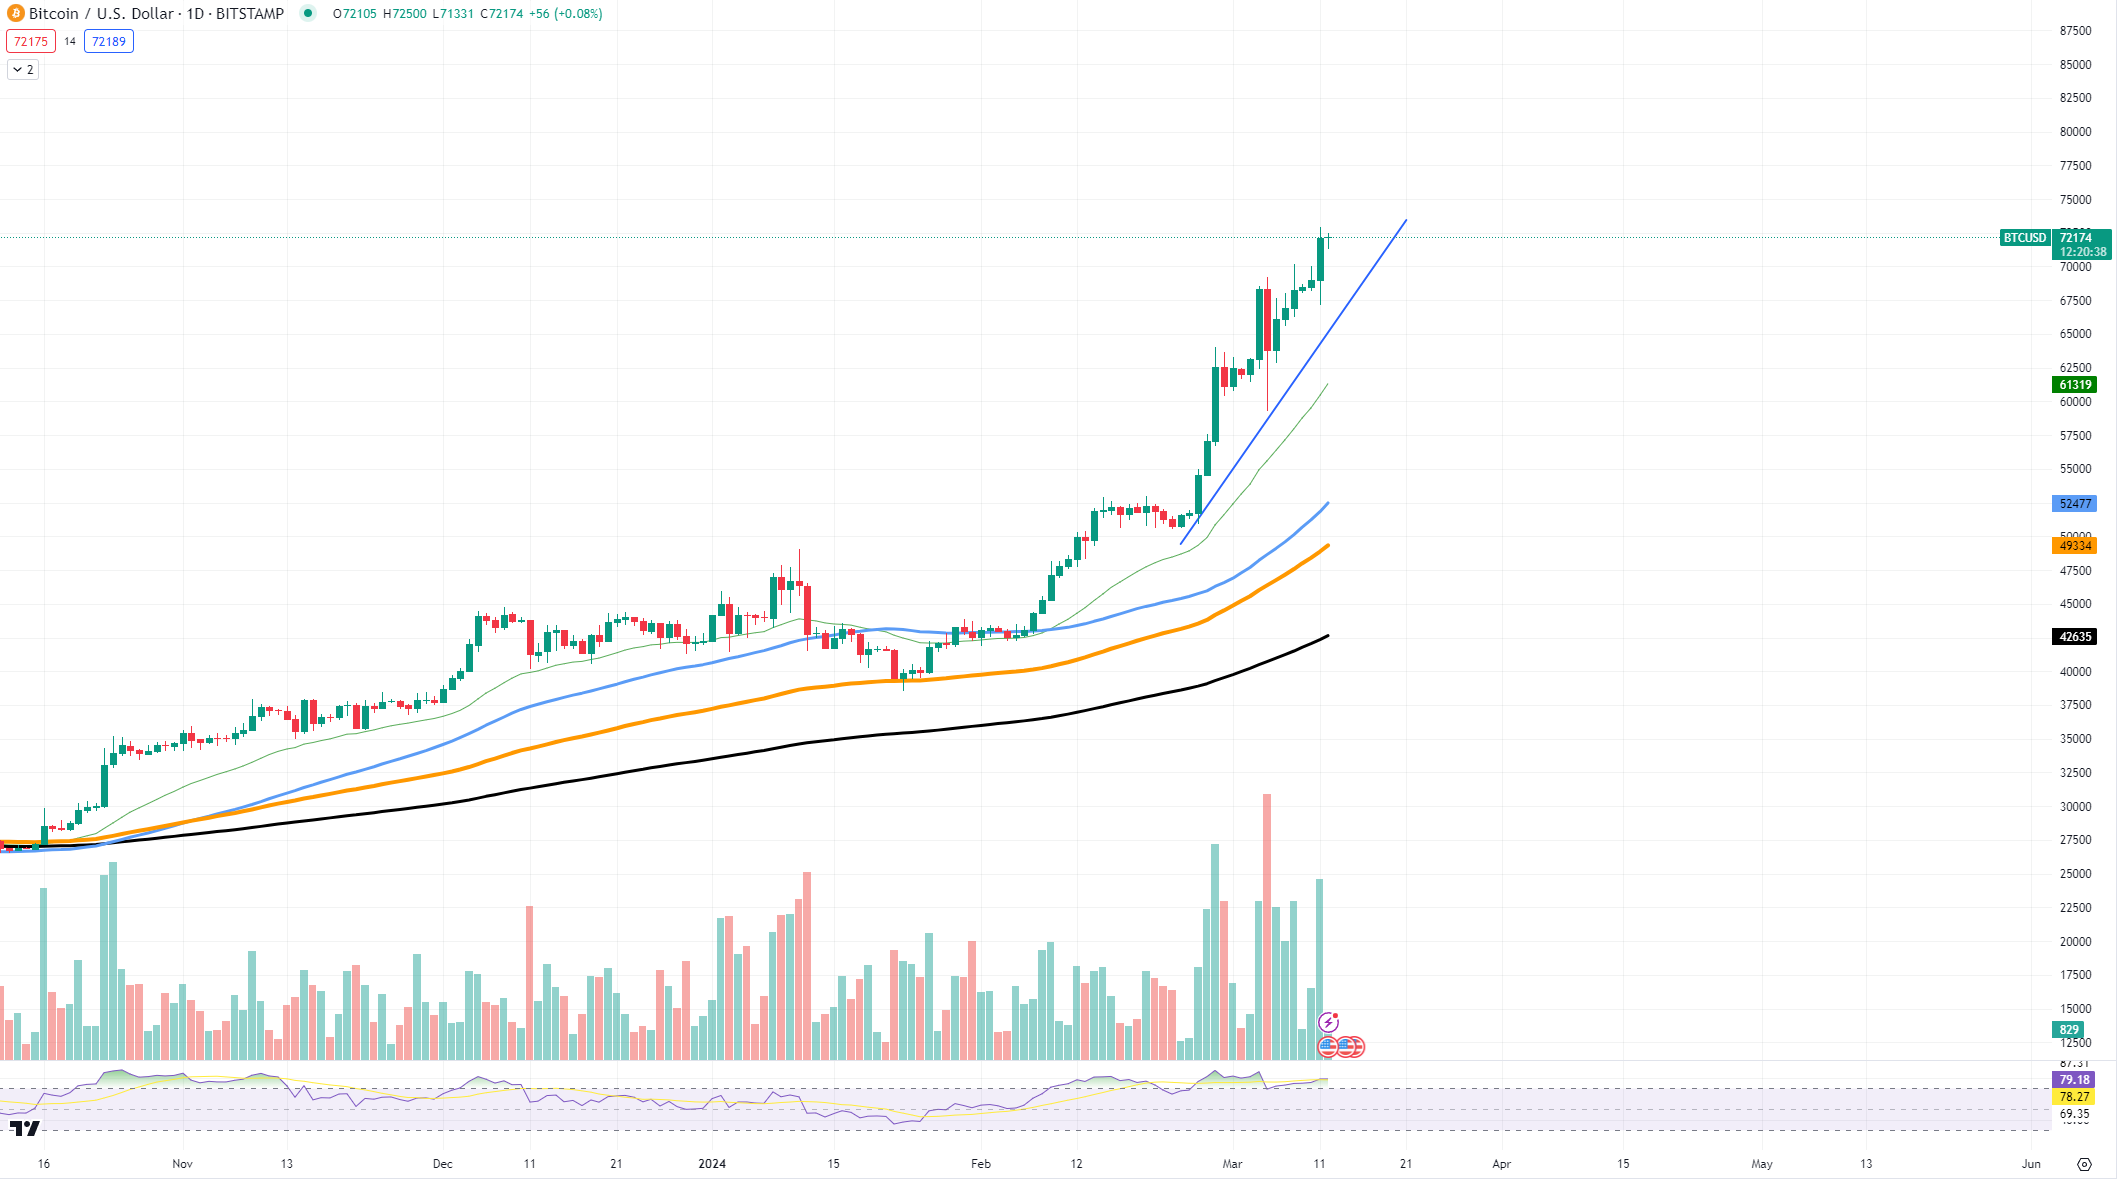
Psychological resistance at all-time highs: Bitcoin’s recent ascent has been nothing short of spectacular. However, as the price hovers around the all-time high, we approach a psychological resistance level. Investors who previously bought at highs might look to break even on their investments, which can lead to increased selling pressure. The current price is lingering around $72,000, a region where profit-taking behavior may intensify, creating a temporary ceiling.
RSI divergence: The Relative Strength Index (RSI) is a momentum indicator that measures the magnitude of recent price changes to evaluate overbought or oversold conditions. An RSI divergence occurs when the price records a higher high, but the RSI fails to confirm this with its own higher high, signaling weakening momentum.

The attached chart might not explicitly show this divergence, but should the RSI demonstrate lower peaks while the price hits higher highs, it would be a classic signal of a potential reversal.
Extended away from moving averages: Bitcoin’s price is now well above its 50-day and 200-day moving averages, a sign of a robust uptrend. However, historically, when prices extend too far from these averages, they tend to revert back to mean values.
This phenomenon could cause the price to retreat toward the support levels of these moving averages, found at around $61,250 for the 50-day MA and $49,995 for the 200-day MA.
 Dan Burgin