Disclaimer: The opinions expressed by our writers are their own and do not represent the views of U.Today. The financial and market information provided on U.Today is intended for informational purposes only. U.Today is not liable for any financial losses incurred while trading cryptocurrencies. Conduct your own research by contacting financial experts before making any investment decisions. We believe that all content is accurate as of the date of publication, but certain offers mentioned may no longer be available.
XRP remains a focal point of almost every discussion in the crypto space in recent days, weeks and months and, as it seems - looking at the price chart of the third biggest cryptocurrency, it will not make major news headlines anytime soon.
XRP is everywhere, from rumors about new exchange-traded funds oriented toward cryptocurrencies to debates regarding the Digital Asset Stockpile, to speculation about where the altcoin might find itself next, given its increasing relevance across different layers of the financial landscape.

And yet, one of the most persistent threads running through all of this - the red line tying together various narratives and speculation - is the sheer relative strength that this popular alternative cryptocurrency continues to demonstrate against its primary counterpart, Bitcoin (BTC).
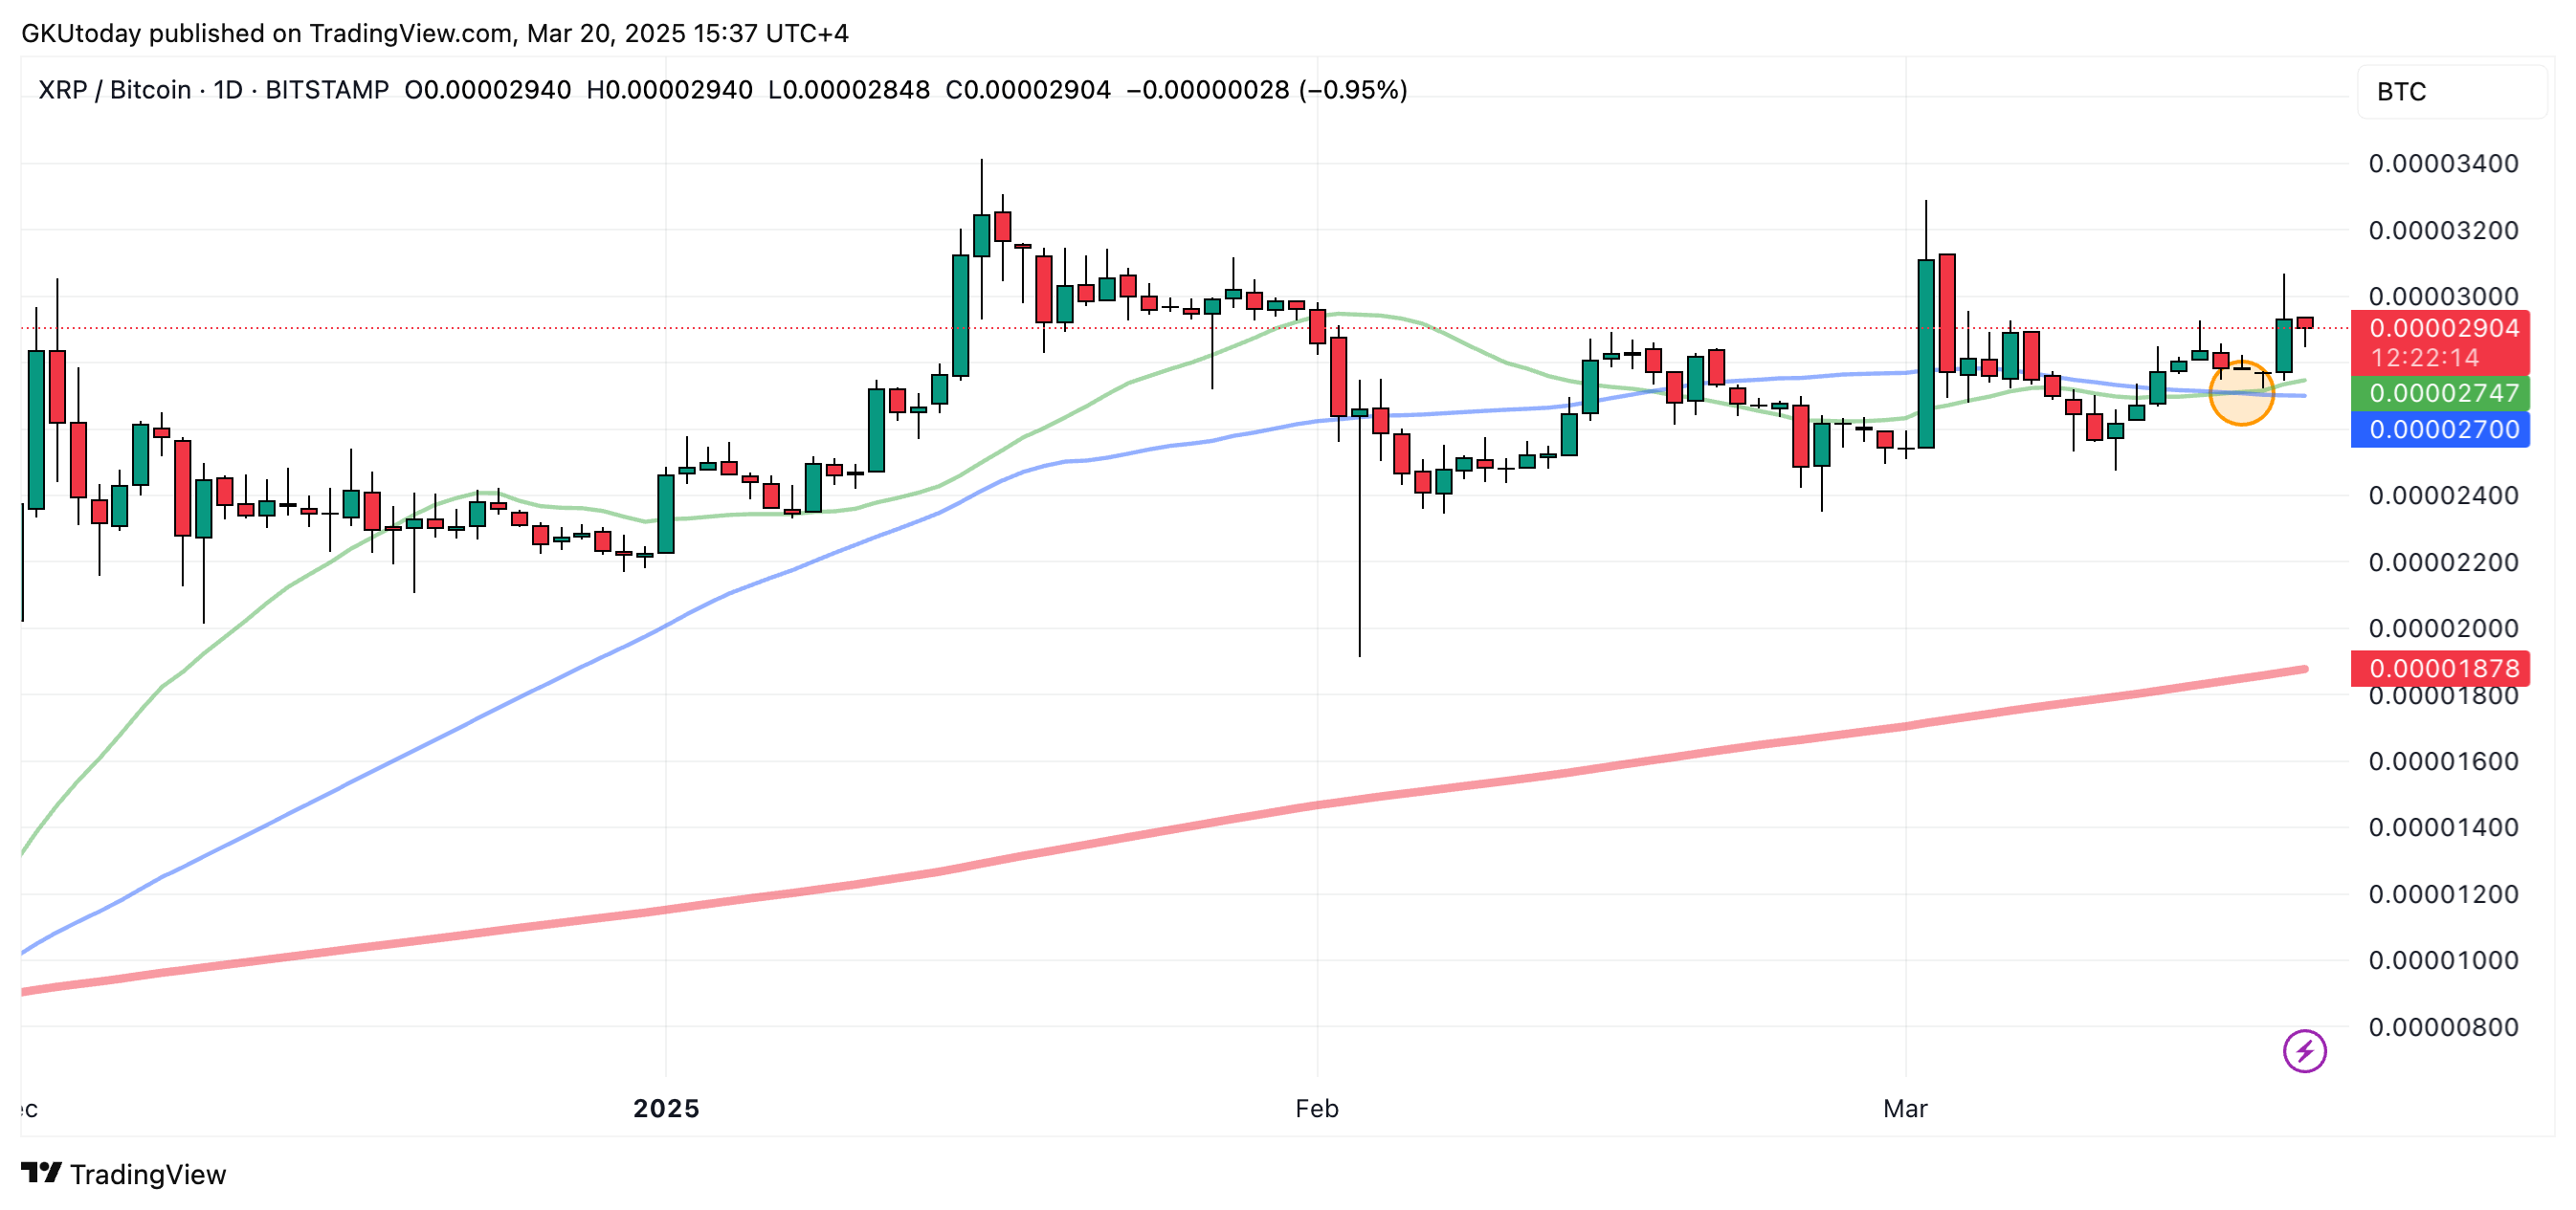
Ever since November, XRP has been on an almost 400% rally against BTC, at one point reaching a pinnacle of nearly 0.000035 BTC back in January. Then came the inevitable consolidation phase, a moment of catching breath after a steep climb.

And yet, despite entering what most would classify as a period of accumulation, the altcoin refused to surrender its momentum against Bitcoin. What the XRP/BTC pair is sketching out on the charts now suggests that it may be gearing up for yet another performance, one that traders and investors alike are watching closely.
The reason?
A golden cross - the technical pattern that tends to turn heads - has recently formed, driven by the 23-day moving average crossing the 50-day curve from below. Such a convergence of price-moving averages is often regarded as a precursor to an upward trend, a pattern that tends to invite speculation, if not outright optimism.
The last time this precise setup emerged within this pair of assets was in November.

That was right before XRP took off on its remarkable run. Whether history decides to play out in a similar fashion remains an open question, but what is clear is that the emergence of this golden pattern in the XRP vs. Bitcoin price chart is something that should not, under any circumstances, go unnoticed.
 Dan Burgin
 U.Today Editorial Team