Disclaimer: The opinions expressed by our writers are their own and do not represent the views of U.Today. The financial and market information provided on U.Today is intended for informational purposes only. U.Today is not liable for any financial losses incurred while trading cryptocurrencies. Conduct your own research by contacting financial experts before making any investment decisions. We believe that all content is accurate as of the date of publication, but certain offers mentioned may no longer be available.
XRP has recently displayed a disappointingly lackluster performance. Despite various developments in the market, XRP's price action remains muted, failing to reflect the dynamism on the market.
A detailed analysis of the XRP chart reveals a concerning trend for investors and traders. The asset has not only been compressing within a narrowing price range, but recent activity shows a breakdown from this consolidation, without a significant recovery in sight.
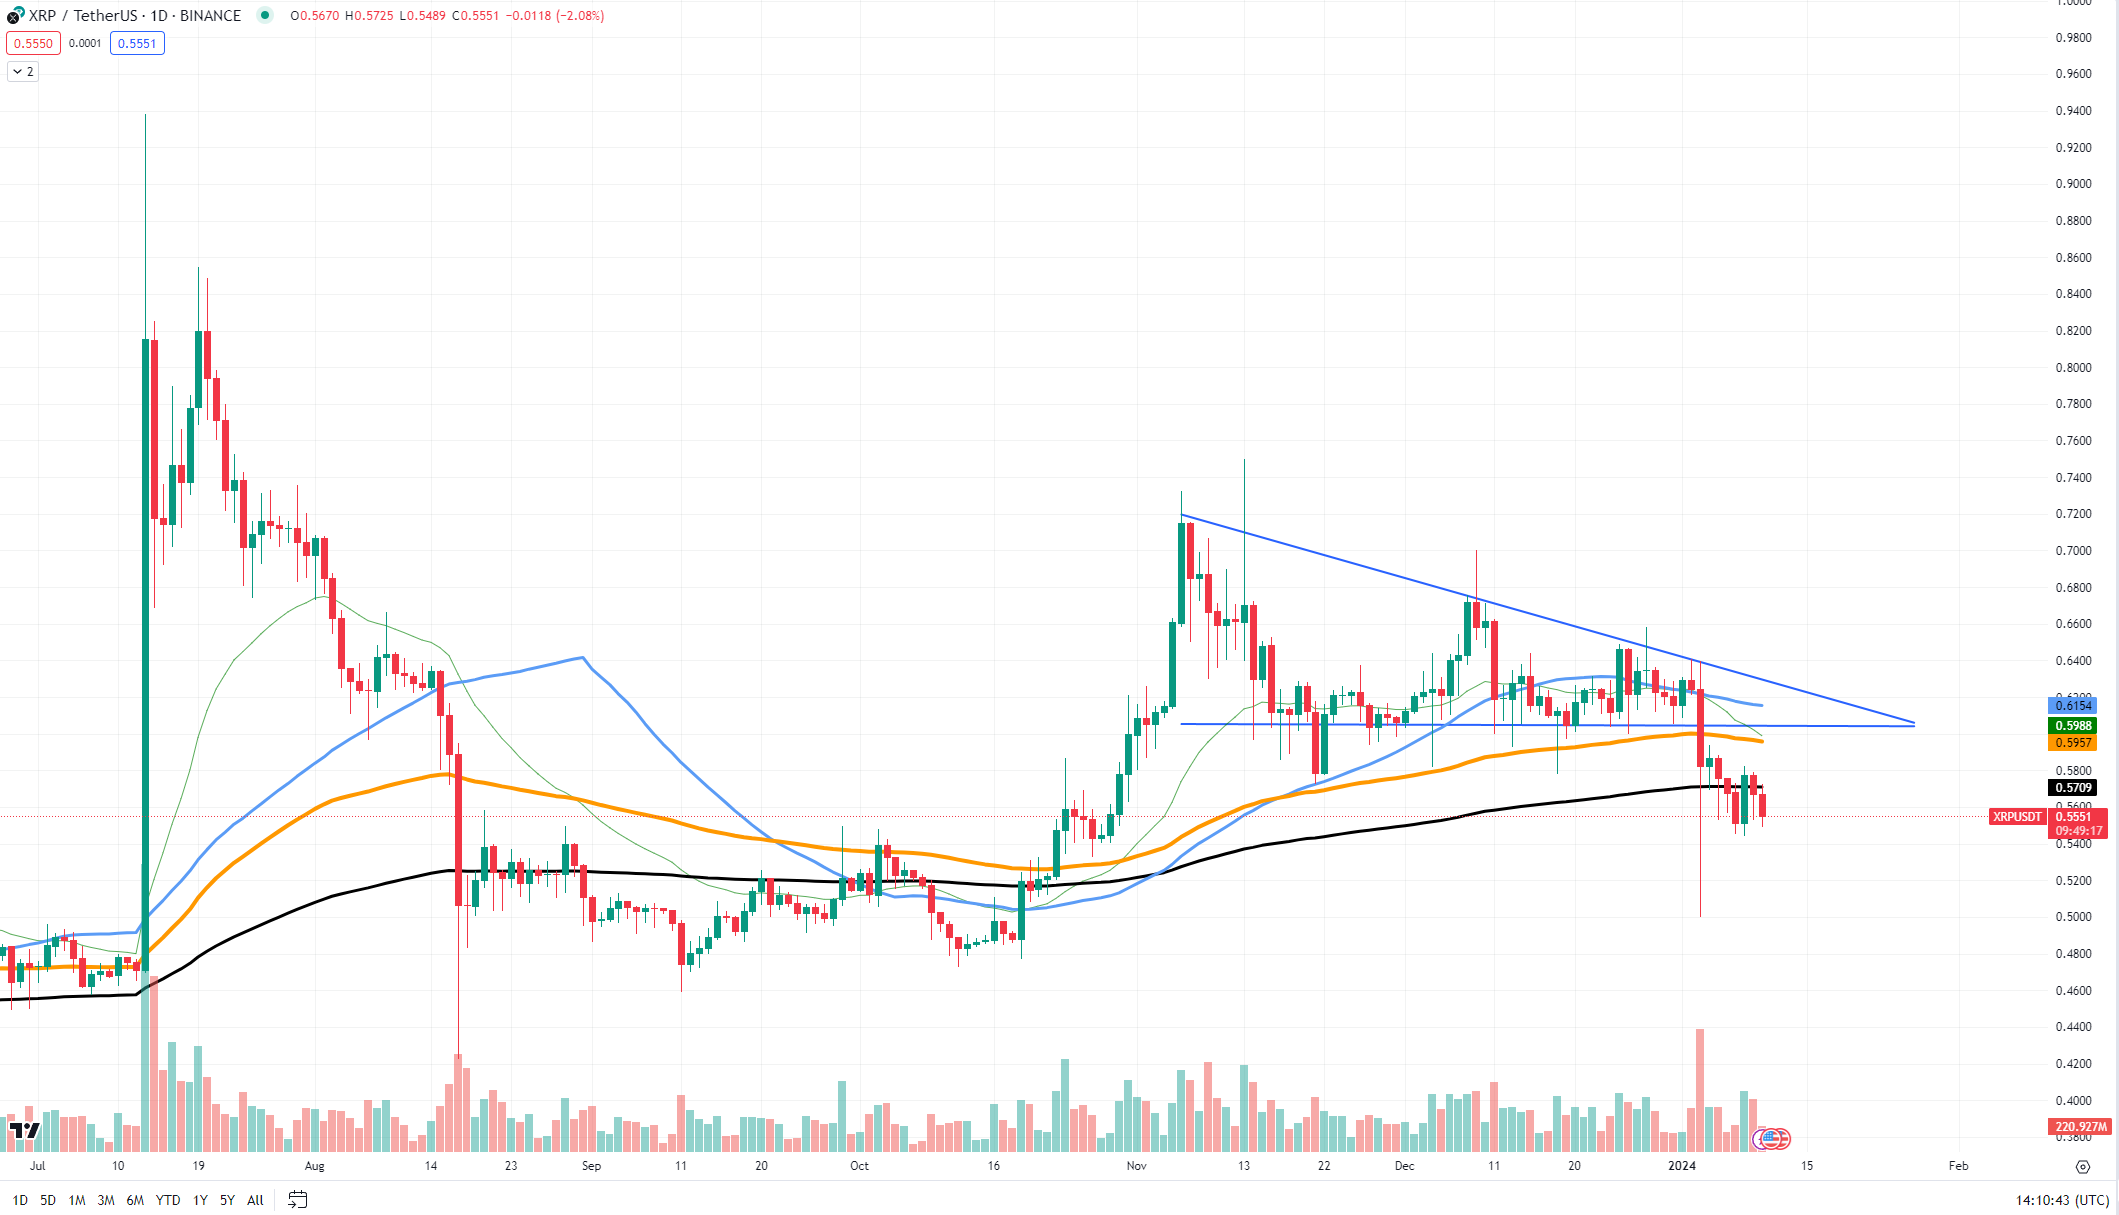
Looking at the technical indicators, XRP has broken below key support levels, including a dip below the crucial 200-day Exponential Moving Average, considered a benchmark for long-term market sentiment. The breakdown below this level is a grim signal and usually suggests the continuation of bearish tendencies on the market.

Moreover, the volume profile shows a significant increase in selling pressure, as evidenced by the heightened volume accompanying downward price movements. This is often read as a bearish sign, suggesting that more traders are looking to exit their positions than enter new ones.
The RSI is a momentum oscillator that measures the speed and change of price movements, hovering near oversold territory. While this could sometimes predict a potential reversal if buyers step in, sustained low RSI levels imply a lack of buying interest and momentum for XRP.
Shiba Inu in trouble... again
Shiba Inu has recently experienced a harsh rejection at the 50-day Exponential Moving Average, signaling a potential increase in bearish sentiment among its holders. This sharp downturn follows a pattern of behavior observed on the market, whereby SHIB investors have been quick to take profits during price surges, leading to abrupt sell-offs.
The chart reveals a U-turn as SHIB approached the 50 EMA, an important technical level that traders often look to as a determinant of short-term market trends. The failure to break above this level suggests that buyers were overwhelmed by sellers, resulting in a price drop. This kind of rejection could be interpreted as a sign of waning confidence in the asset's immediate growth prospects, as the 50 EMA acts as a litmus test for bullish momentum.

Historically, SHIB has displayed volatility, with rapid price increases followed by significant pullbacks, as many investors look to capitalize on short-term gains. The recent price action is reminiscent of this pattern, with the token unable to sustain its upward trajectory, leading to a sharp correction.
Compounding this bearish outlook is the astonishing 27,500% increase in the SHIB burn rate. While burning mechanisms are typically employed to reduce supply and potentially drive up a token's price, the magnitude of the surge is impressive. Unfortunately, it did not help SHIB that much.
Long live Arbitrum
Arbitrum, one of the leading layer-2 scaling solutions for Ethereum, has made an unexpected comeback, with 23% growth from its local price bottom. This impressive rebound is a bullish signal that has defied the expectations of many investors and analysts, hinting at a newfound momentum that could propel the network to new heights in the short term.
This recent surge in ARB's price not only reflects strong buyer conviction but also aligns with the thesis that layer-2 solutions are likely to be the primary beneficiaries in the current market cycle, especially as the Ethereum ecosystem continues to mature and expand. The growth of layer-2 networks like Arbitrum is pivotal, as they offer a solution to Ethereum's scalability challenges by processing transactions off the main Ethereum chain.
Arbitrum's price action, as observed on the charts, shows a strong recovery trend, with the token swiftly moving past key resistance levels. This sort of robust price movement indicates a significant level of support and could very well be a precursor to more bullish behavior in the coming days.
As layer-2 networks continue to gain traction, the role of Arbitrum in this ecosystem cannot be overstated. With its recent performance, ARB has demonstrated that it is not only a key player in the layer-2 space but also a network with the potential to make unexpected moves that could shape the future of the Ethereum landscape.
 Dan Burgin
 U.Today Editorial Team