
Disclaimer: The opinions expressed by our writers are their own and do not represent the views of U.Today. The financial and market information provided on U.Today is intended for informational purposes only. U.Today is not liable for any financial losses incurred while trading cryptocurrencies. Conduct your own research by contacting financial experts before making any investment decisions. We believe that all content is accurate as of the date of publication, but certain offers mentioned may no longer be available.
As conditions on the cryptocurrency market worsen, XRP is going through a major price breakdown. Following the U. S. government announcement, a widespread panic on the market led to the most recent decline in the price of XRP.
Nvidia Corp. received subpoenas from the Department of Justice and additional businesses in a probe concerning antitrust. This action had a significant negative impact on the tech industry, which was reflected in the Nasdaq's steep decline and the cryptocurrency market. Ethereum fell under $2,400, and Bitcoin experienced a sharp decline to almost $56,000.
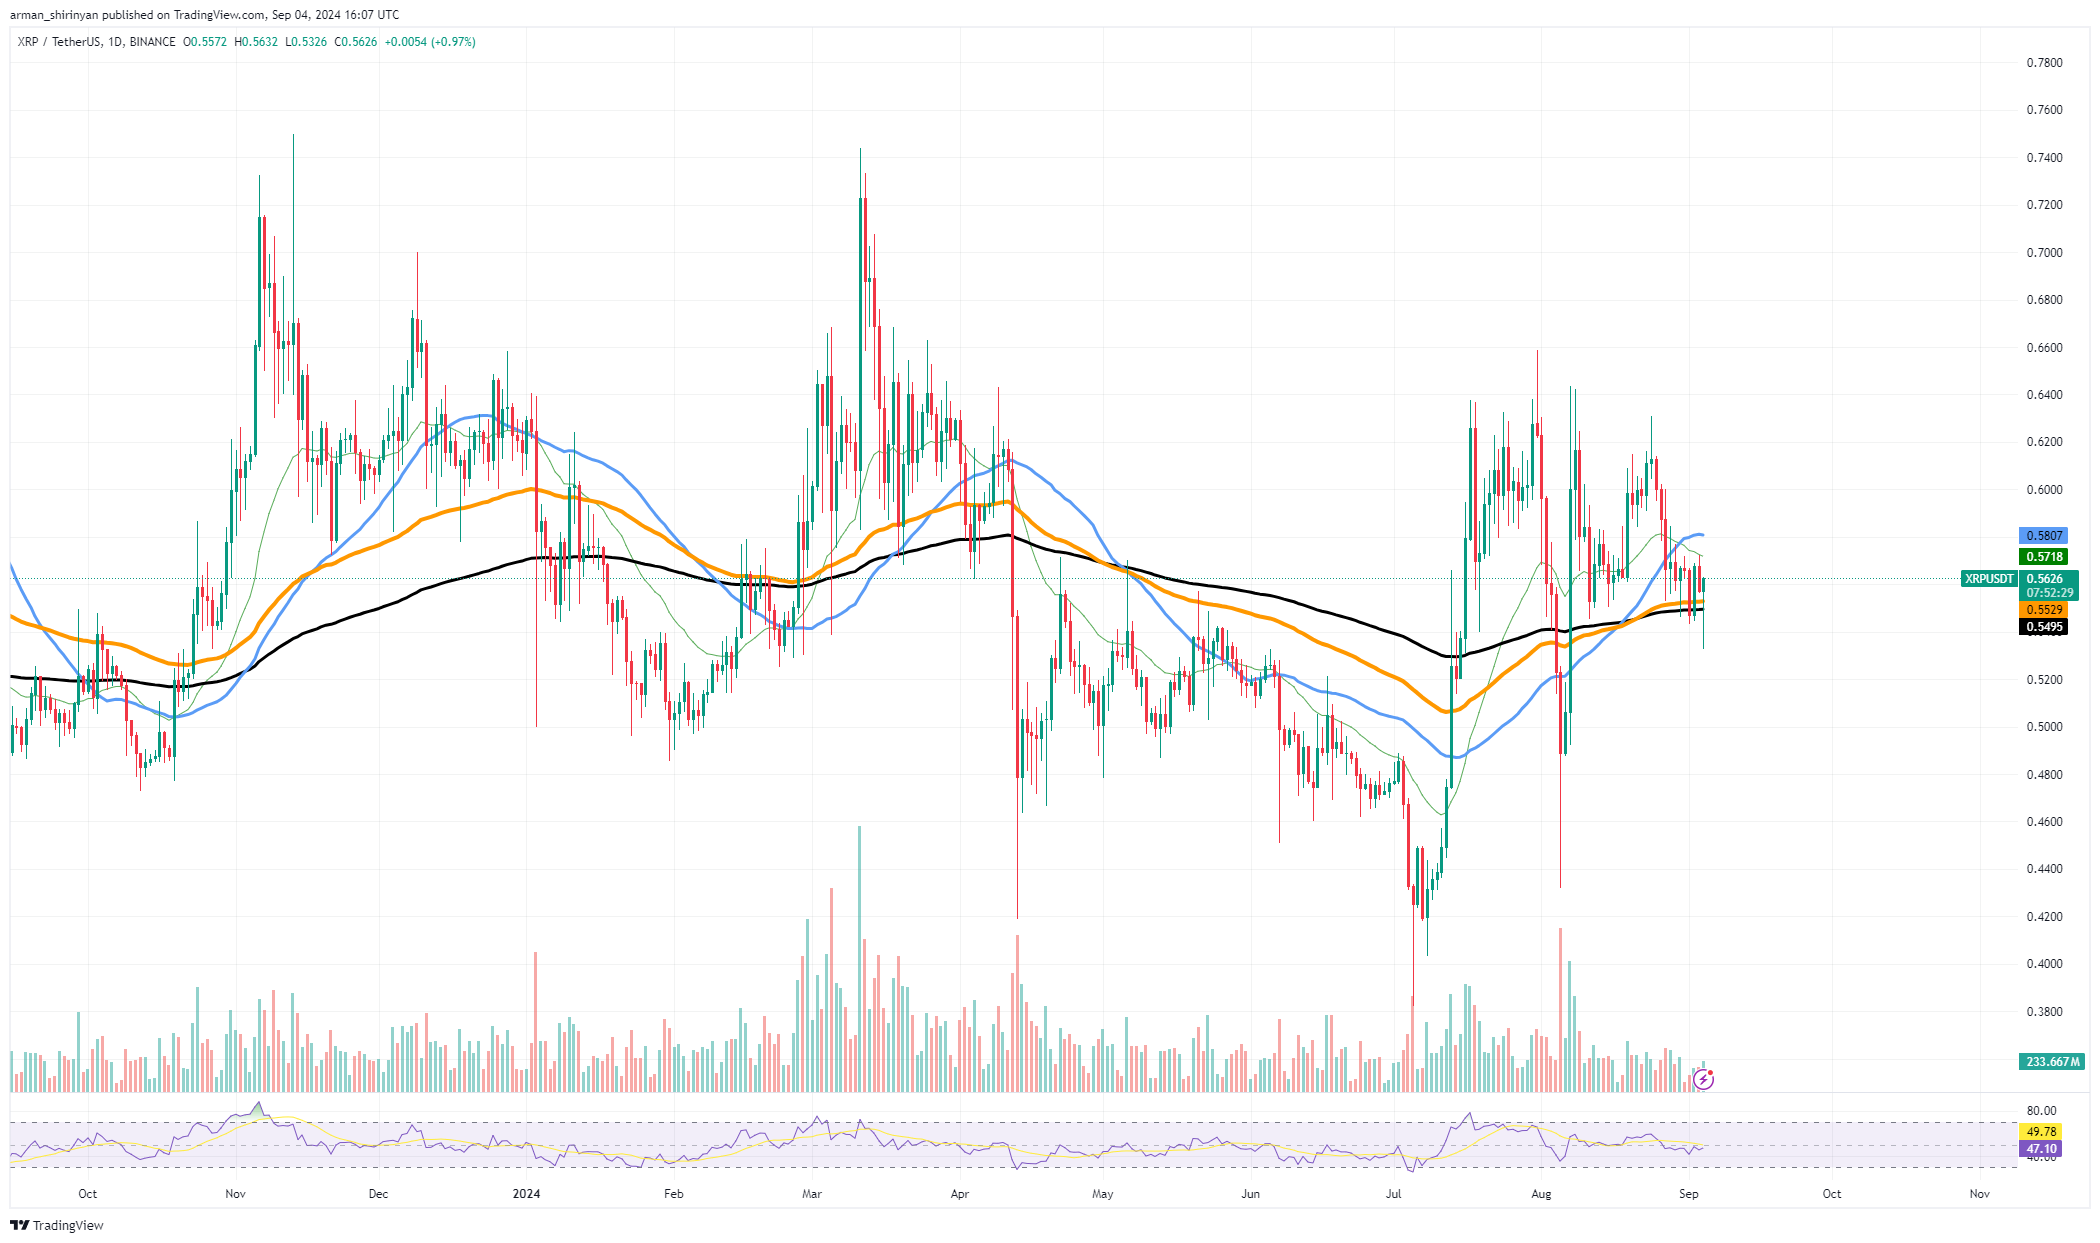
One hundred and eighty minutes later, positions in cryptocurrency worth $118 million were liquidated, of which $107 million were long positions. XRP was negatively impacted by the strong selling pressure that had a domino effect on the altcoin market. In terms of technical analysis, XRP is currently trading in the $0.55 range, and recent trends indicate that the asset is finding it difficult to hold onto important support levels.
The chart illustrates how XRP broke below its 50-day moving average, indicating a change in the trend toward bearishness. The asset is vulnerable to additional declines because it is currently moving below both the 200-day and 100-day moving averages, which is significant downward pressure. It looks that $0.52 is the immediate support level for XRP, but if the current bearish momentum holds, a decline toward $0.50 or even lower may be in store.
Slowing buying pressure and increasing selling interest are indicated by the relative strength index (RSI) downward trend. It is unlikely to expect a quick recovery because of a combination of macroeconomically driven marketwide bearish sentiment and XRP's technical weakness.
Shiba Inu sees candlestick reversal
Shiba Inu is beginning to exhibit indications of a possible reversal following a stretch of steady declines. The hammer candlestick pattern that SHIB has formed in the most recent market action is usually a bullish indication that a reversal may be approaching.
When an asset displays a long lower wick with a small body following a sell-off, it may indicate strong buying pressure and a potential trend reversal. But in the larger context where the whole cryptocurrency market is still experiencing pressure, this candlestick pattern appears.

The U.S. Department of Justice's continuous investigation into Nvidia and possible antitrust violations has caused a tremor in the tech industry and precipitated significant drops in the Nasdaq and cryptocurrency markets.
Famous cryptocurrencies like Ethereum dropped below $2,400, and Bitcoin dropped to about $56,000. This increased the pressure on altcoins like SHIB, as these movements also led to massive liquidations that erased over $118 million in cryptocurrency holdings. The hammer candlestick offers hope for a bounce as SHIB's price action is centered around $0.0000130.
SHIB would need to retreat to about the $0.0000148 mark, a crucial level of resistance and a threshold where it previously struggled in order for the bullish momentum to fully take hold. A stronger, longer-lasting rebound may be indicated if the price can break above it.
Ethereum falls out
With the recent invalidation of its ascending range, Ethereum, the second-largest cryptocurrency, may be in trouble. The fact that ETH dropped below the lower edge of its ascending channel, as shown in the chart, is a bearish indication that more short-term downside movement may be ahead.

This failure coincides with Ethereum's current difficulties, which are exacerbated by pressure on the entire cryptocurrency market. The lack of trading volume concurrent with this price decline is another worrying factor. A declining volume generally indicates that there is not enough demand from buyers to sustain a possible recovery, which might cause even more significant price corrections.
Concern is mounting that if Ethereum falls below $2,400, selling pressure may increase, particularly if volume does not increase. Neither is Ethereum aided by the general mood of the market. ETH may continue to struggle in the upcoming days, as Bitcoin is experiencing similar downward momentum, and the altcoin market as a whole is struggling.
 Dan Burgin
 U.Today Editorial Team