
Disclaimer: The opinions expressed by our writers are their own and do not represent the views of U.Today. The financial and market information provided on U.Today is intended for informational purposes only. U.Today is not liable for any financial losses incurred while trading cryptocurrencies. Conduct your own research by contacting financial experts before making any investment decisions. We believe that all content is accurate as of the date of publication, but certain offers mentioned may no longer be available.
The native token of the Stellar network, XLM, may be poised for a major price appreciation rally. At least, Bollinger Bands hint at such an opportunity. The popular indicator developed by John Bollinger consists of three bands, which include an upper, middle and lower curve.
The Bollinger Bands track price changes and help predict potential volatility, and thanks to their reliability, they earned the indicator widespread adoption across various financial markets.

As things stand, XLM has successfully maintained above the middle curve on the weekly time frame for the second week back to back. This, on one side, indicates a bullish willingness to defend this zone for XLM, which is currently at around $0.322 per coin and also installs a bias for the Stellar token to hit the upper band at $0.6257, which is 88% above current levels.
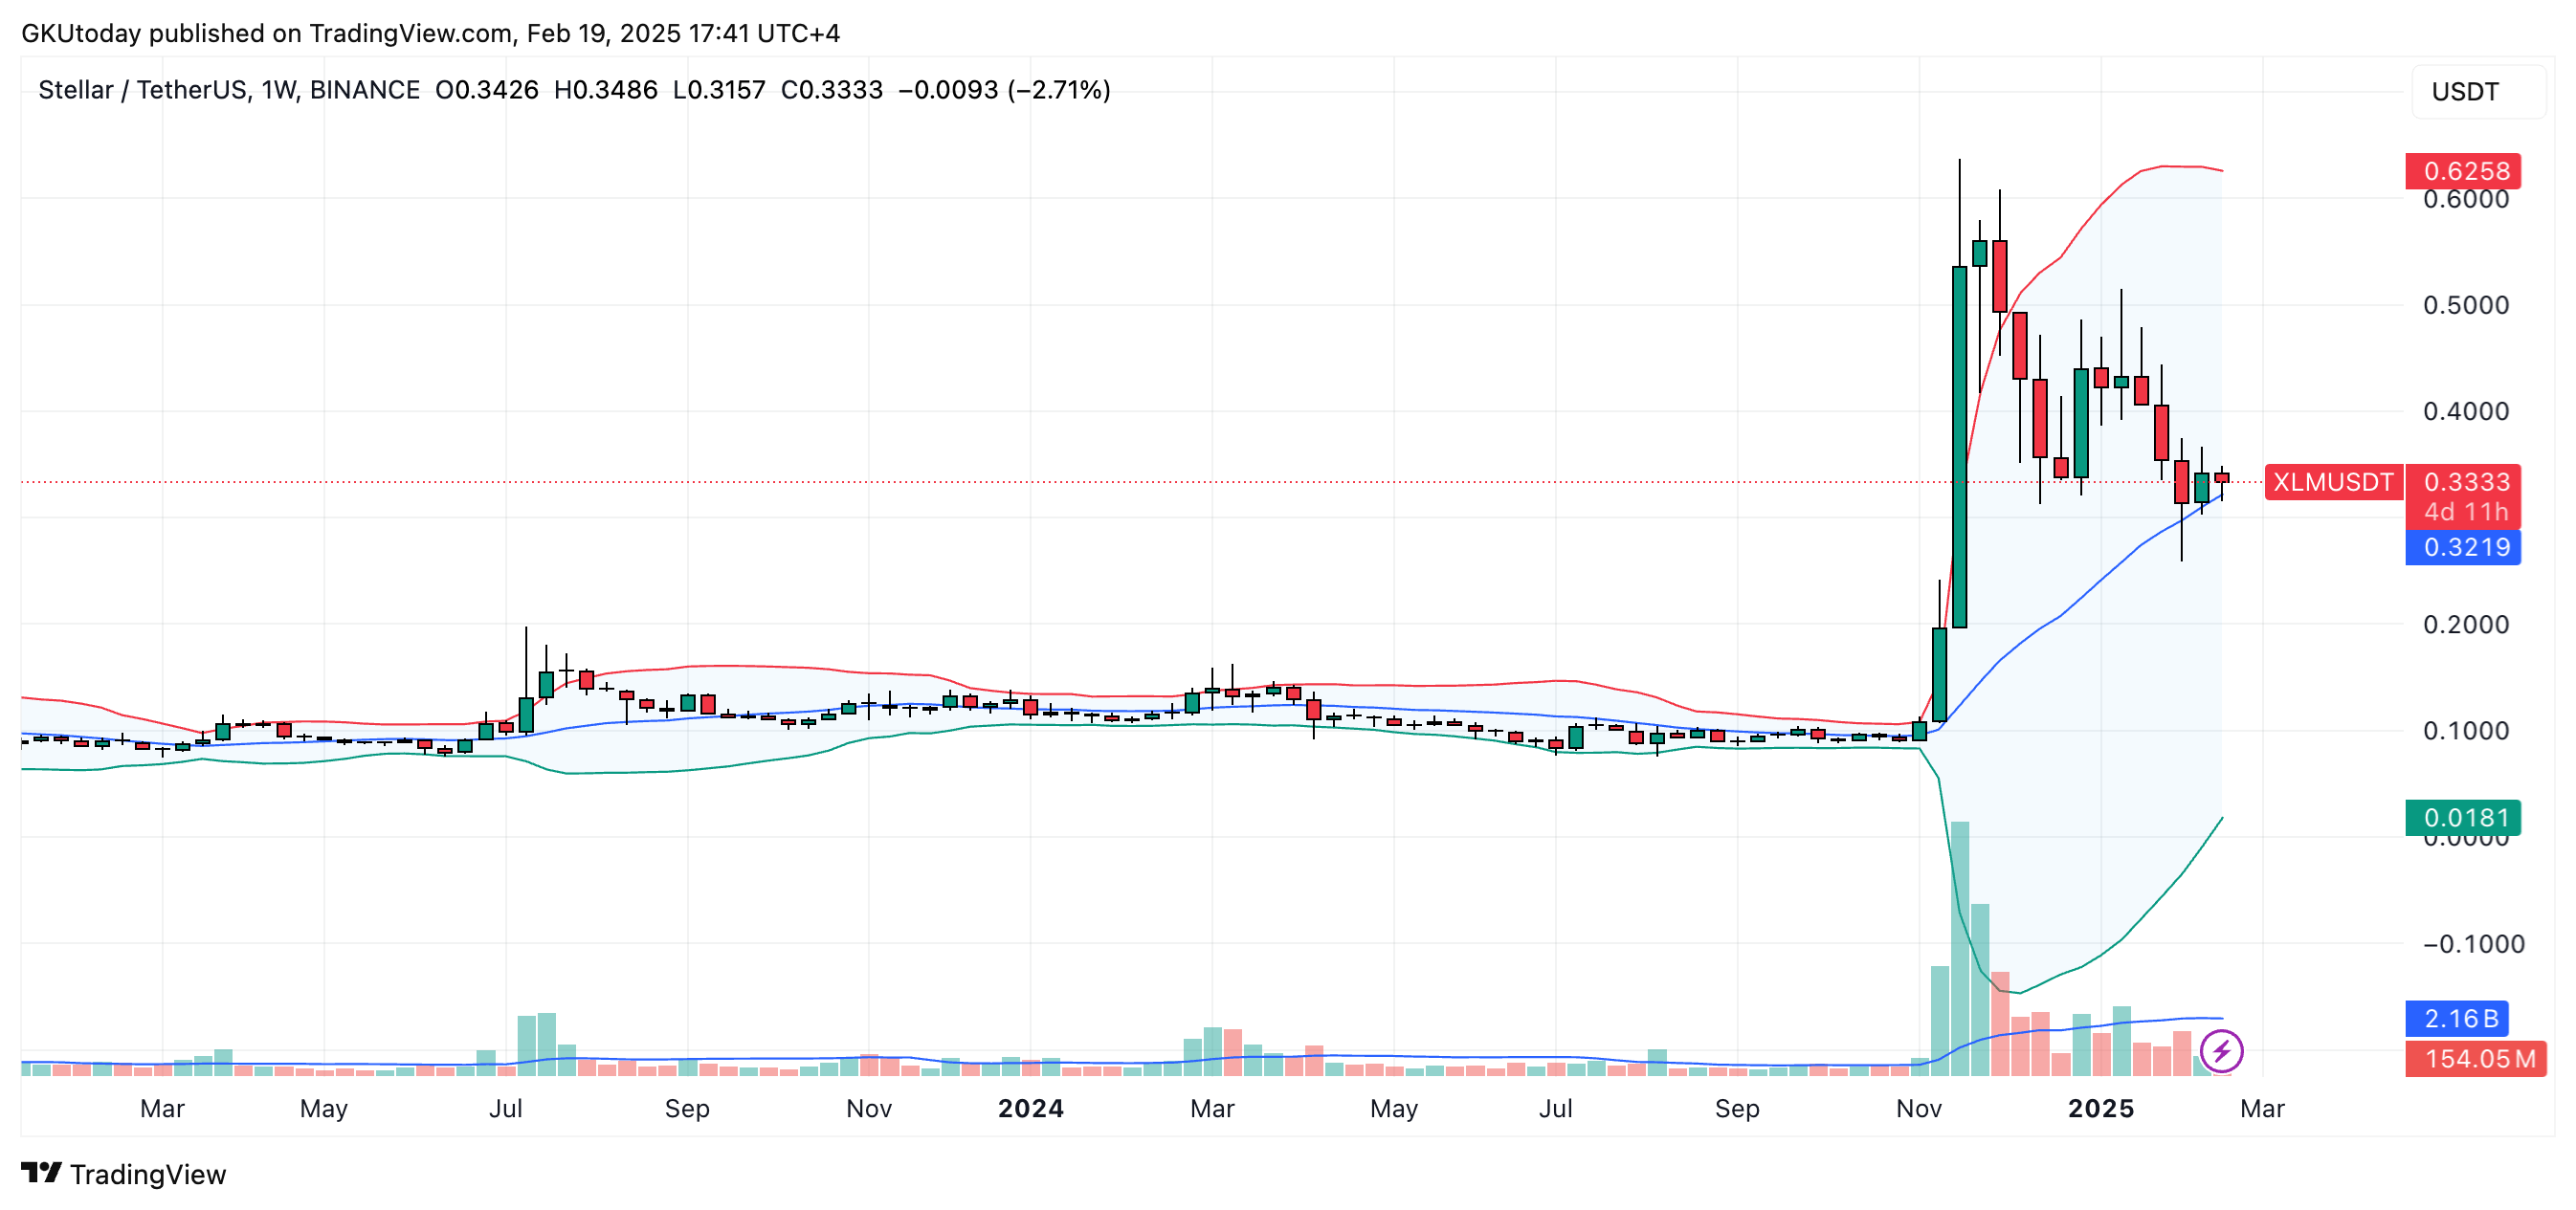
In this case, the Stellar token will return to its local highs set last November. Since then, the price of XLM corrected by about 45% and returned right to the middle Bollinger Band.
If, however, this sacred line is breached on the weekly time frame, then things will turn ugly for XLM as the bias will turn to bearish and the main scenario becomes a dip to the lower band at around $0.018, which is 94.51% below the current level.

Sounds wild, but these are weekly time frame estimations, which makes this kind of prognosis more midterm, or even long term. No need to panic or cheer yet.
So, where does this leave XLM? Right at the crossroads. The next few weeks will be crucial in determining whether it sticks to its bullish trajectory or falters toward deeper corrections.
 Dan Burgin