
Disclaimer: The opinions expressed by our writers are their own and do not represent the views of U.Today. The financial and market information provided on U.Today is intended for informational purposes only. U.Today is not liable for any financial losses incurred while trading cryptocurrencies. Conduct your own research by contacting financial experts before making any investment decisions. We believe that all content is accurate as of the date of publication, but certain offers mentioned may no longer be available.
XRP's path up was tough, long and painful for a lot of investors. However, on July 12, the breakthrough began with the price of the asset reaching $0.6 in no time at all. Unfortunately, though, things are getting complicated, as a bearish candlestick pattern appears and volume shows a descending tendency.
Following its descent to $0.6, XRP began to exhibit strength, breaking above important resistance levels such as the 50 EMA, 100 EMA and 200 EMA. Traders and investors were upbeat after this big move. But a bearish candlestick pattern that recently emerged points to possible difficulties down the road.
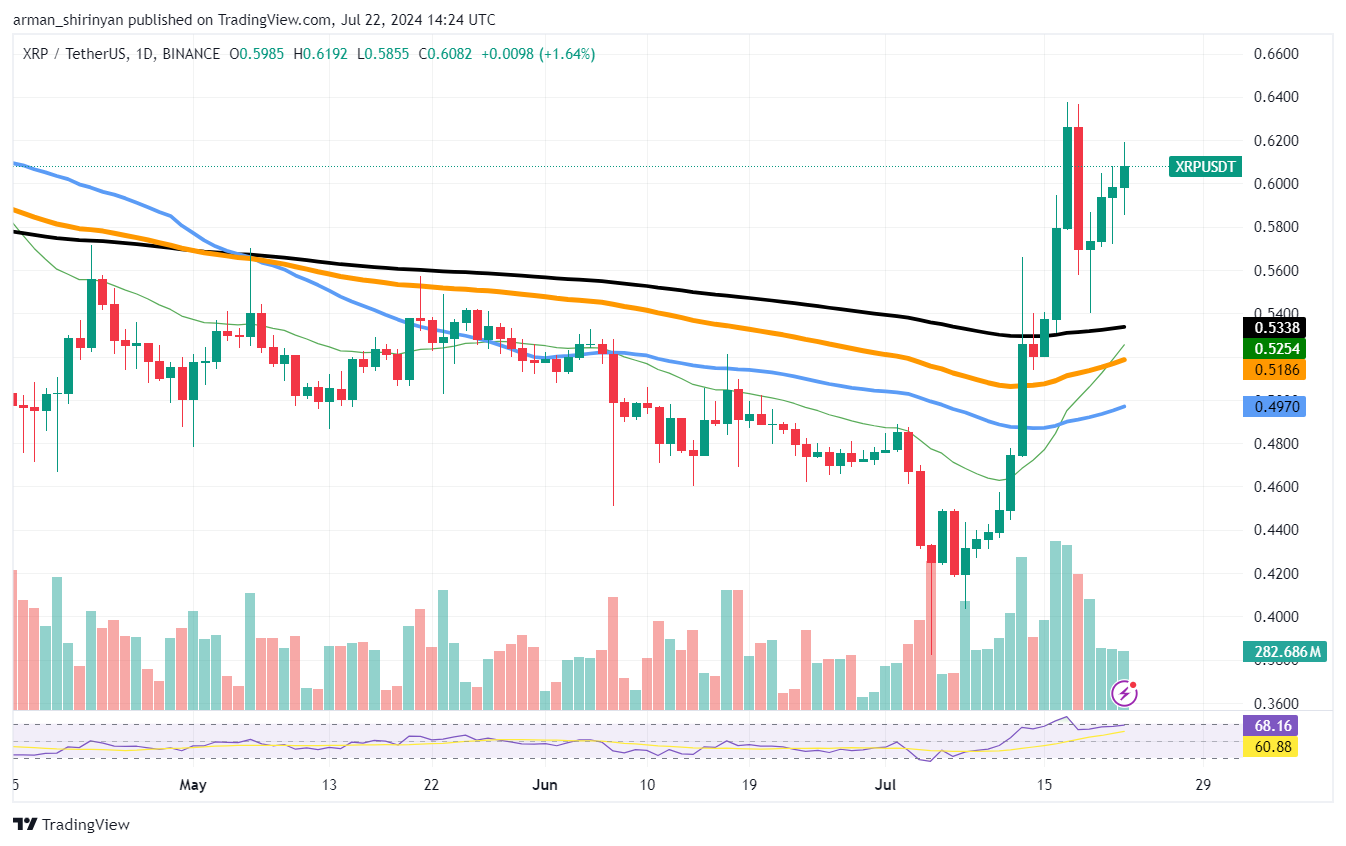
Support at 50 EMA: The immediate support level to keep an eye on is the 50 EMA, which is located at $0.50. Should XRP dip below this level, it may indicate additional declines. Additionally, the 200 EMA at $0.53 and the 100 EMA at $0.52 act as critical support levels that may help to keep the price stable.
$0.65 resistance: The $0.65 level serves as a noteworthy upward resistance. A break above this could rekindle the bullish momentum and push XRP toward higher targets - perhaps as high as $0.70.
Bearish reversal: If the bearish candlestick pattern holds and volume does not increase, XRP may retreat to the previously indicated support levels. This situation might point to a period of consolidation, or if selling pressure picks up an even deeper correction.
Sideways movement: A period of sideways trading, during which XRP swings between $0.50 and $0.65, is an additional possibility. This would suggest that traders are hesitating to make big moves on the market, waiting for more definitive signals.
Ethereum got hit
Ethereum faced an unexpected surge of selling pressure at approximately the $3,550 price threshold. It led to an immediate drop toward the $3,400 zone and will most likely cause a reversal from here, considering the lack of volume.
Continued downtrend: Ethereum may keep declining if selling pressure does not abate and volume does not increase. At roughly $3,300, which is symbolized by the orange 100 EMA, is the next important support level. This level is crucial for traders to keep an eye on because ETH might drop to the 200 EMA (black), which is located at $3,118, if it fails to hold.

Bounce from support: In contrast, Ethereum might find a strong level of support at $3,400, which could result in a possible bounce back. This support is located close to the blue 50 EMA, which has historically served as a pivotal level. The price of ETH may try to recover the $3,550 mark and perhaps even reach higher resistance levels near $3,700 if buying interest rises.
Sideways movement: A period of consolidation is another possible outcome. The market may be looking for direction, so Ethereum may trade sideways between $3,400 and $3,550. Until a major catalyst prompts a breakout in either direction, this range-bound trading could go on.
Toncoin turns bearish
Toncoin's growth from May to July was impressive; the asset has been constantly gaining value, moving above key indicators and not showing any signs of a reversal. However, as soon as traders saw more attractive investment options, TON's momentum was gone.
The 200 EMA at roughly $5.49 and the 100 EMA at roughly $6.62 are the next support levels to keep an eye on. For a possible reversal, these zones are crucial. TON may stabilize and regain some upward momentum if it can find support at these levels.

There is less buying interest, as seen by the decline in trading volume. Unless new buyers step in to support the price, this reduced volume may result in further price reductions. A bounce in TON may be expected if the selling pressure lessens as the RSI is getting closer to the oversold area.
At these levels, TON may stabilize and even rise higher if it can establish a foothold. TON might experience additional losses, though, if the selling pressure keeps up and these support levels fall through. Keep a watchful eye out for any indications of a market reversal and exercise caution.
 Dan Burgin
 U.Today Editorial Team