
Disclaimer: The opinions expressed by our writers are their own and do not represent the views of U.Today. The financial and market information provided on U.Today is intended for informational purposes only. U.Today is not liable for any financial losses incurred while trading cryptocurrencies. Conduct your own research by contacting financial experts before making any investment decisions. We believe that all content is accurate as of the date of publication, but certain offers mentioned may no longer be available.
XRP is currently in the spotlight as it encounters a pivotal moment in its market journey. After making an attempt to break through, XRP found resistance at the 26-day Exponential Moving Average, hinting that the asset might be on the cusp of a potential retracement.
XRP's price action was halted at the 26 EMA, a level known for its dynamic resistance properties. This halt is indicative of a potential shift in momentum, suggesting that sellers are regaining control after a period of buying activity. If this selling pressure persists, XRP could see its price descend toward the $0.50 mark — a significant psychological and technical support level that has historically acted as a floor for the asset's price.
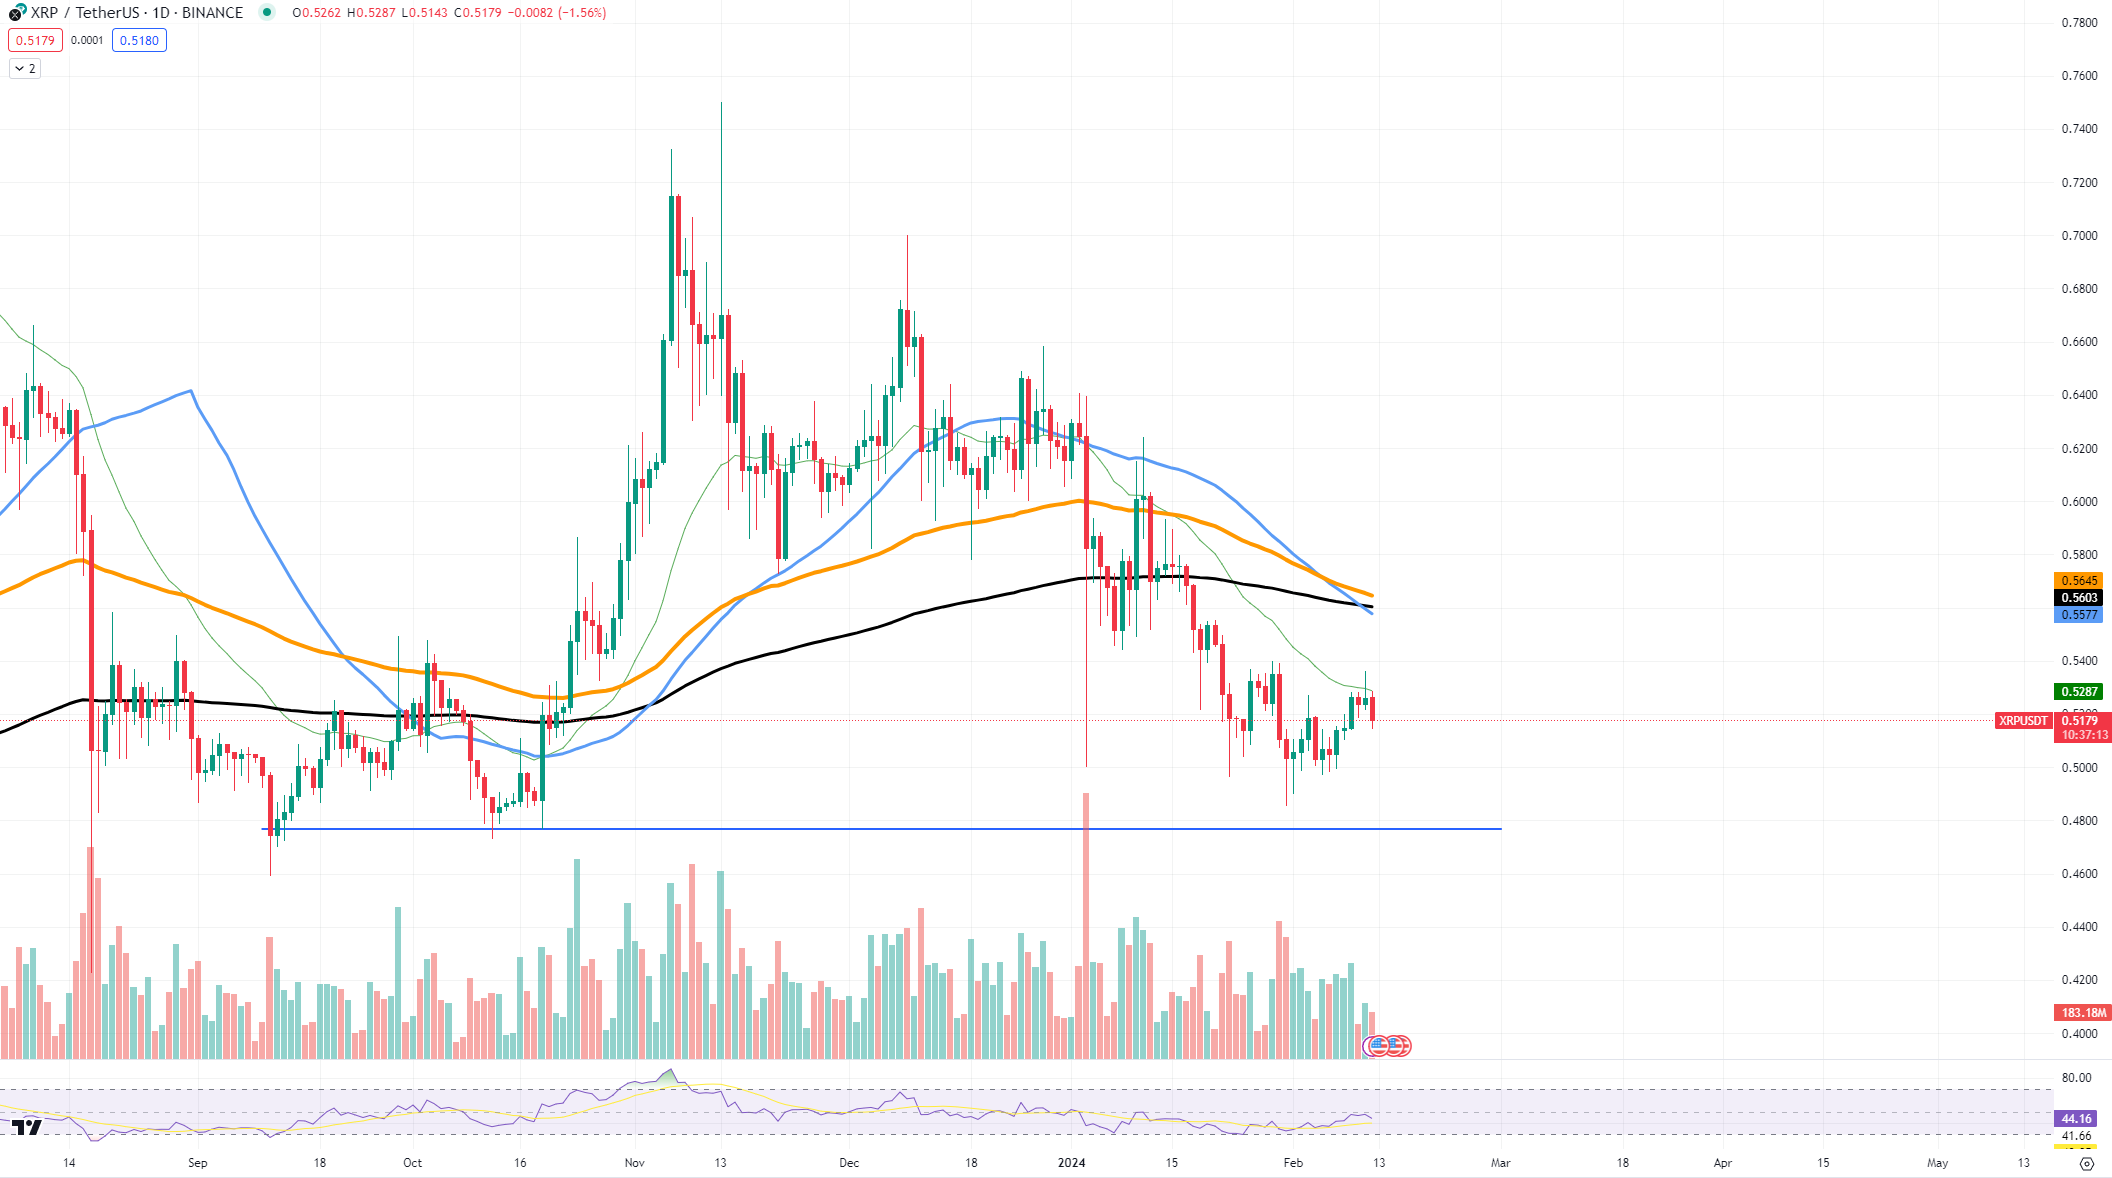
The $0.50 support level is not just a round number that resonates with traders psychologically; it is also a region where buying interest has previously emerged, providing a cushion for the asset's value. Should XRP drop to this level, it will be crucial to observe the market's reaction to ascertain whether a rebound is feasible or if a further downside is likely.
On the growth side, if XRP can muster enough buying pressure to overcome the resistance posed by the 26 EMA, there could be a chance for recovery and an upward move. A sustained break above this moving average could invalidate the bearish scenario and potentially pave the way for a move toward the next resistance near $0.56, where the 50-day EMA converges.
Shiba Inu uptrend halted
The crypto community has been closely monitoring Shiba Inu as its recent rally has paused, causing many to speculate about the token's next move. Despite this setback, SHIB is currently positioned between the 100 and 50 Exponential Moving Averages on the daily chart, which could indicate a potential consolidation phase before the next leg up or down.
The 50-day EMA, sitting at approximately $0.0000094, is serving as the immediate resistance level for SHIB. This dynamic line has capped previous price attempts and will be the barrier SHIB needs to break through to reignite its rally. Conversely, the 100-day EMA, positioned around $0.0000088, stands as a support level, providing a safety net where buying interest has historically emerged.

For growth, should SHIB push pass the resistance at the 50-day EMA and hold above this level, it could signal renewed investor confidence, possibly steering the asset toward the next resistance at $0.000010. Such a scenario would require significant volume and positive sentiment to drive SHIB beyond its current stagnation.
On the flip side, if SHIB fails to break through the resistance and slips below the 100-day EMA, it might face a drop toward $0.0000080, where further support could be found. A price drop to this level could indicate that a deeper retracement is underway, potentially shaking out weak hands and allowing for accumulation by steadfast believers in the asset's long-term potential.
Bitcoin surge is not baseless
Bitcoin has recently been surging past the crucial $48,220 mark. This recent breach suggests a bullish sentiment has taken hold, but it also introduces the possibility of a forthcoming phase of correction or consolidation before further potential gains.

A closer look at the BTC price chart reveals that the asset has indeed pushed through a significant resistance level at $48,220. However, in the growth scenario, if Bitcoin consolidates above this newfound support and builds sufficient pressure, we could witness a continuation of the rally.
The next major resistance level lies around the psychologically significant $50,000 mark. A convincing move above this threshold could solidify Bitcoin's position and invite a fresh wave of bullish momentum.
Conversely, should Bitcoin retract and fail to uphold the $48,220 level, it could see a price drop toward the next substantial support near the $45,000 region. This scenario might play out if the market experiences a sell-off from traders looking to capitalize on the recent spike or if wider economic factors catalyze a move away from risk assets.
Currently, the intersection of the 50-day and 100-day EMAs is acting as a dynamic area of interest, potentially indicating where Bitcoin might find equilibrium during a retracement. The moving averages may serve as a litmus test for Bitcoin's immediate directional bias.
 Dan Burgin
 U.Today Editorial Team