Disclaimer: The opinions expressed by our writers are their own and do not represent the views of U.Today. The financial and market information provided on U.Today is intended for informational purposes only. U.Today is not liable for any financial losses incurred while trading cryptocurrencies. Conduct your own research by contacting financial experts before making any investment decisions. We believe that all content is accurate as of the date of publication, but certain offers mentioned may no longer be available.
XRP has once again taken market watchers by surprise. After showing signs of a potential breakthrough, the digital asset has made an unexpected U-turn, dashing the hopes of many investors.
Recent data indicates that XRP, which had been gearing up to break through the 200 Exponential Moving Average (EMA) — a key technical indicator — has failed to do so. The 200 EMA often acts as a critical resistance or support level, and a breakthrough typically signals a strong bullish or bearish trend. In XRP's case, the failure to surpass this level suggests that the bullish momentum was not as strong as previously anticipated.
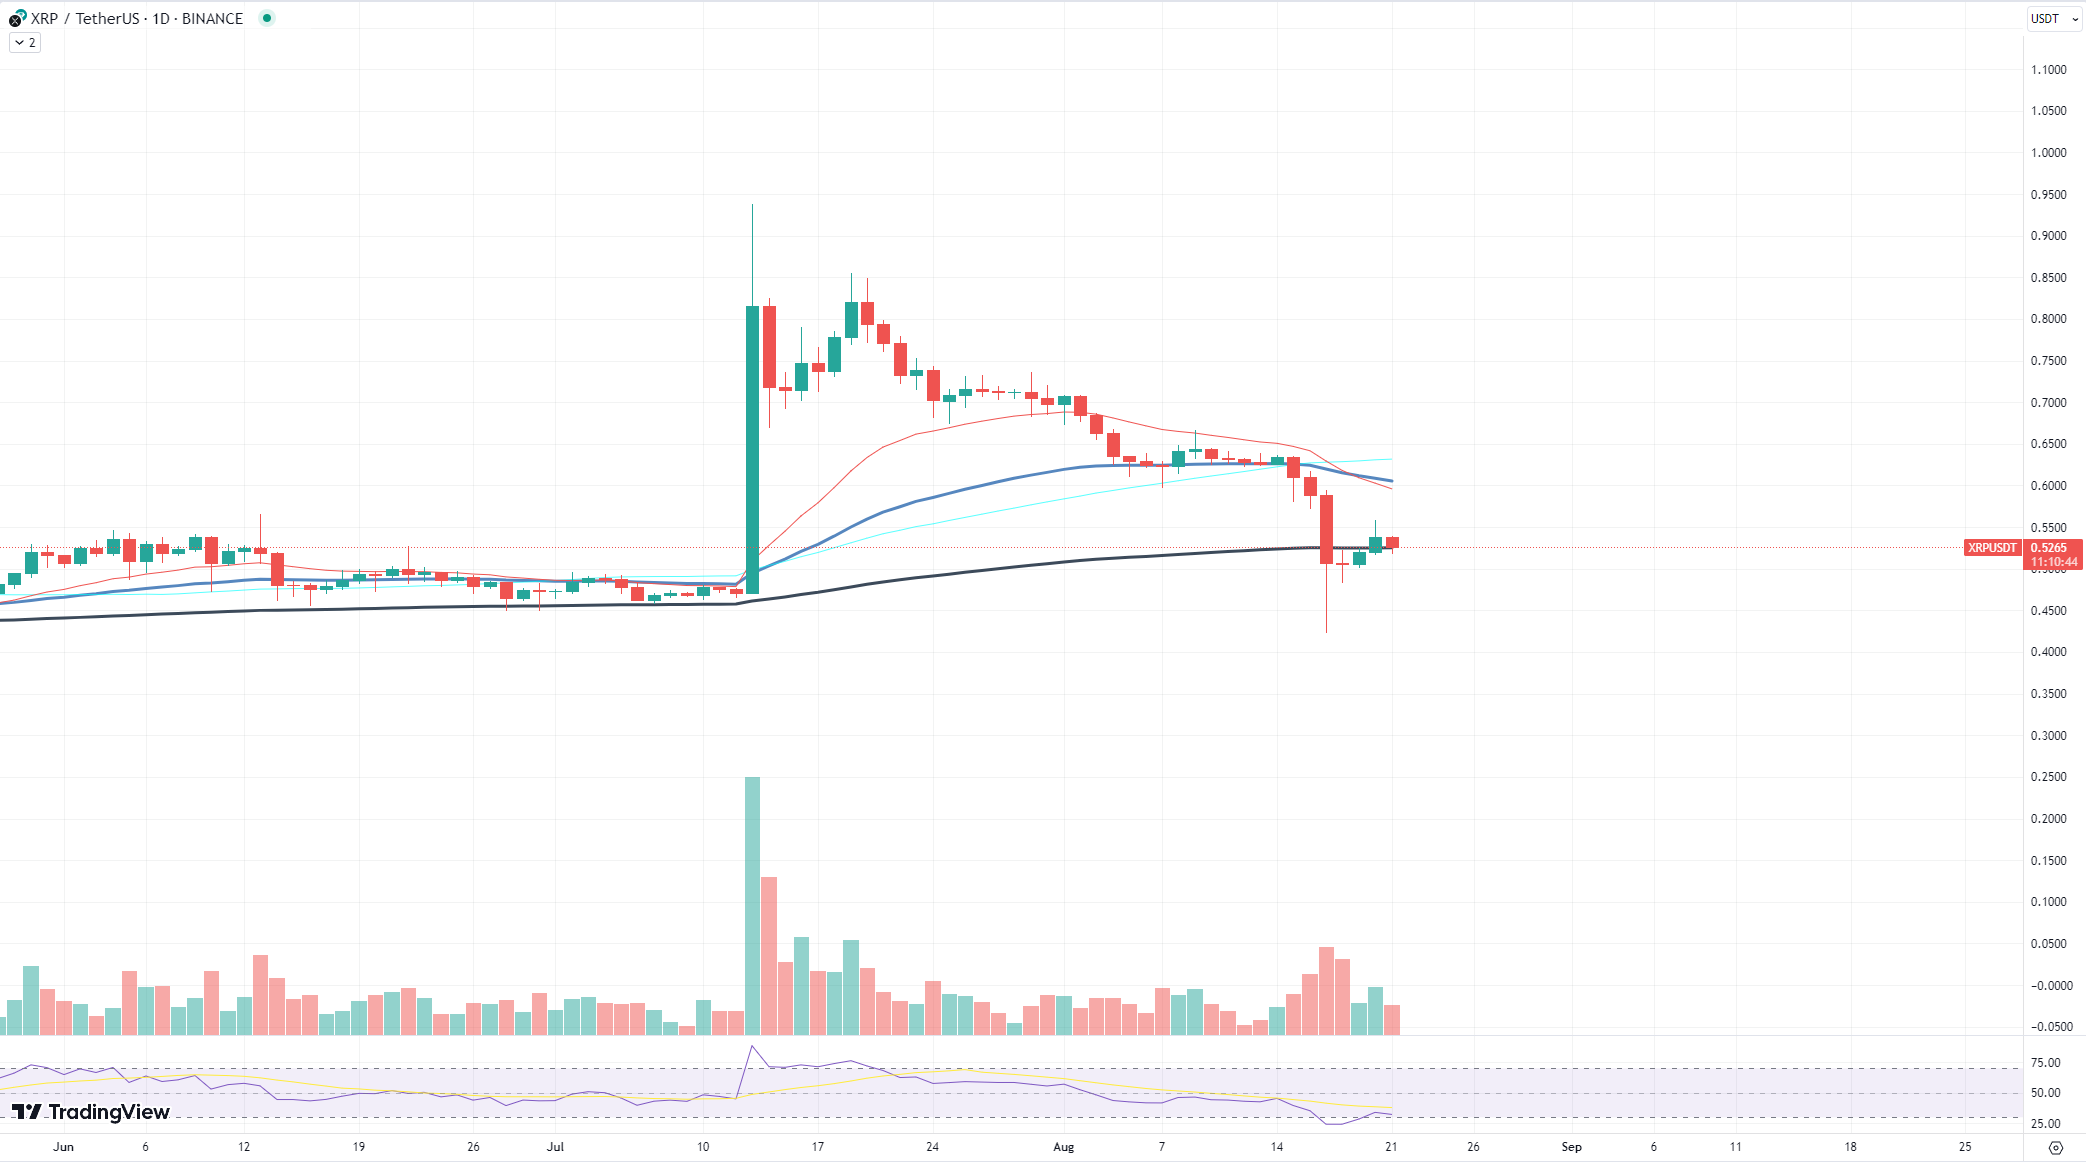
As of the latest data, XRP is trading at approximately $0.5207. This price level is reminiscent of the performance we have seen in the past, indicating that the digital currency is back to its previous trading range. The inability to sustain above the 200 EMA and the subsequent price drop can be disheartening for traders who had been banking on a continued upward trajectory.
Ethereum tests out new bottom
Ethereum (ETH), the second largest cryptocurrency by market capitalization, has recently showcased significant price movement, breaking through a crucial resistance level. As of the latest data, Ethereum is trading at approximately $1,670.57, indicating positive momentum in its price trajectory.
This breakthrough comes after Ethereum faced a challenging period in which bears attempted to push its price toward the $1,500 mark. However, Ethereum demonstrated resilience, bouncing off around this price level, and has since been on an upward trajectory. The recent surge has allowed Ethereum to surpass the psychological resistance level of $1,647, which had been a point of contention for traders and investors alike.
Historically, the $1,647 mark has been a significant resistance level for Ethereum. The fact that Ethereum has managed to break through this level suggests a potential shift in market sentiment. It is worth noting that resistance levels, once broken, can often turn into support levels.
The question on everyone's mind now is: What's next for Ethereum? While it is challenging to predict the exact future movements of any cryptocurrency, the recent price action suggests bullish sentiment on the market for Ethereum. If Ethereum can maintain its position above the $1,647 level and continue its upward momentum, we might witness further price appreciation in the coming days.
Cardano's rally ended up being short-lived
Cardano (ADA), one of the top cryptocurrencies by market capitalization, has been showcasing a price performance that can be best described as a "house of cards." The recent price increase, which many investors celebrated, might be short-lived, and here's why.
Cardano's trading volume has been alarmingly low, indicating a lack of strong buying interest from the broader market. A low trading volume, especially during a price rise, can be a red flag. It suggests that the price increase is not backed by a substantial number of buyers, making the asset vulnerable to sharp downturns. In essence, without a solid foundation of high trading volume, the price structure can easily collapse, much like a house of cards.
Furthermore, the volatility of ADA has been on the lower side. While low volatility can sometimes be a sign of stability, in the context of a rising price with low volume, it can be a cause for concern. Low volatility in such scenarios indicates that the price might not have the momentum to sustain its upward trajectory.
As the latest data, Cardano is trading at approximately $0.2674. While this might seem like a decent price point, especially considering recent upticks, the underlying metrics suggest caution. The lack of substantial trading volume and the low volatility make ADA susceptible to rapid price corrections.
 Dan Burgin
 U.Today Editorial Team