Disclaimer: The opinions expressed by our writers are their own and do not represent the views of U.Today. The financial and market information provided on U.Today is intended for informational purposes only. U.Today is not liable for any financial losses incurred while trading cryptocurrencies. Conduct your own research by contacting financial experts before making any investment decisions. We believe that all content is accurate as of the date of publication, but certain offers mentioned may no longer be available.
In recent days, XRP's moving averages have been converging, indicating that the cryptocurrency may be on the verge of a volatility spike. This development comes as the price of XRP has been steadily declining for a few days in a row, leading to a substantial loss among investors.
Currently, XRP appears to be forming either a hanging man or a spinning bottom pattern, both of which could signal a reversal of the ongoing downward price action. A hanging man pattern forms at the end of an uptrend and is characterized by a small body with a long lower wick.
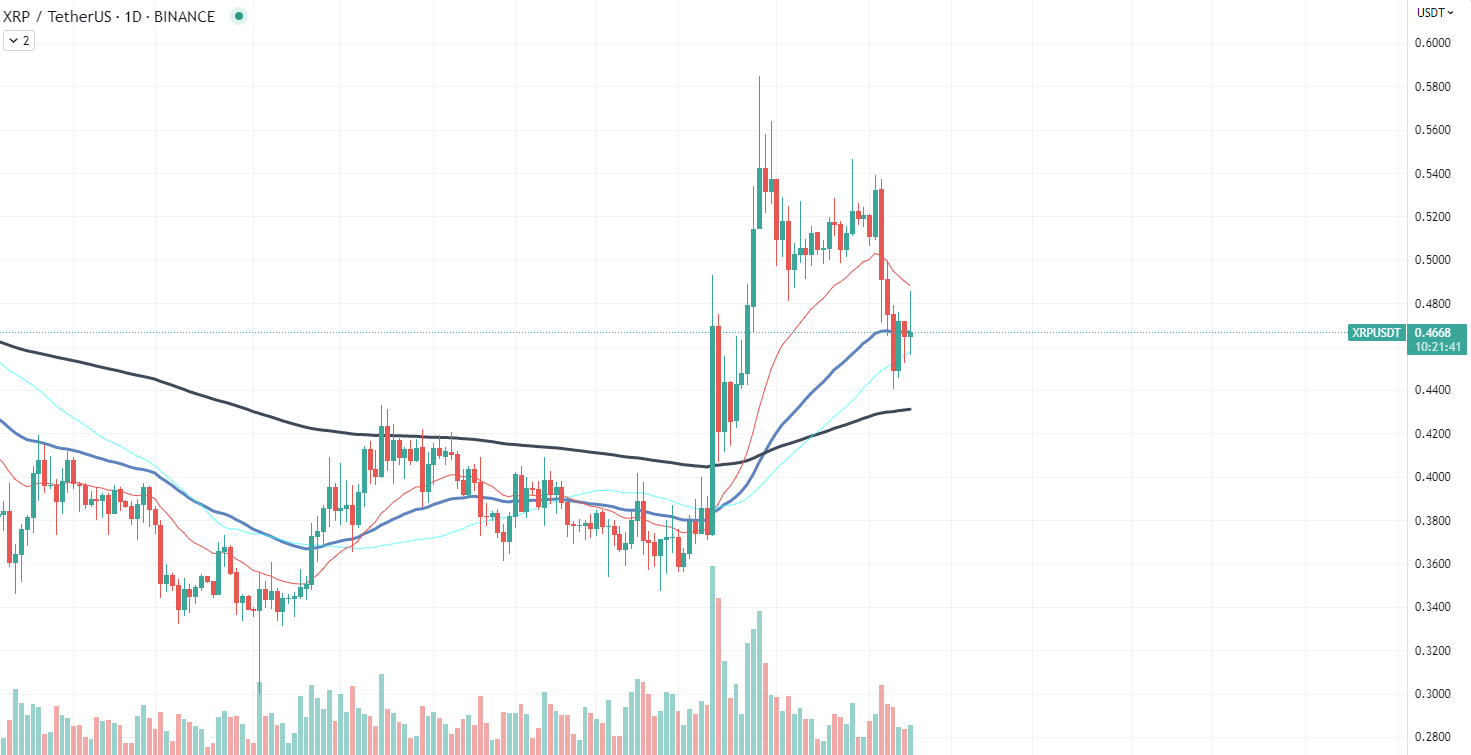
Conversely, a spinning bottom pattern has a small body with both long upper and lower wicks, indicating indecision in the market. Both patterns suggest that the bears may be losing their grip, and a bullish reversal could be imminent.
On lower time frames, XRP is also forming a symmetrical triangle, a pattern that can be a precursor to significant price movements in either direction. However, the direction of the breakout is uncertain, making it essential for traders to watch the price action closely.
Ethereum aims at reversal
Ethereum, the world's second-largest cryptocurrency, appears to be on the brink of a market reversal, according to various technical indicators. With the overall crypto market seeming to cool off, Ethereum's price action displays several signs that a shift may be imminent.
First, Ethereum has landed on the 50-day Exponential Moving Average (EMA), a widely-watched indicator that tracks the average price of an asset over a specified period. The 50 EMA often acts as a support or resistance level for the price, and in this case, it serves as a potential support level for Ethereum, suggesting that the price may bounce back up from there.

Moreover, the volume of Ethereum trades has been steadily decreasing. Descending volume can be interpreted as a sign that selling pressure is subsiding, and a reversal may be on the horizon. Coupled with the Relative Strength Index (RSI) sitting at 40, which indicates that the market could be approaching oversold territory, these factors create a compelling case for a potential reversal.
Another signal that Ethereum may be facing a shift in direction is the convergence of its moving averages. When moving averages come closer together, it can be an indication that a period of consolidation is about to end, and a new trend could be developing. In this case, the convergence of Ethereum's moving averages could point to an impending bullish reversal.
Lastly, the overall cryptocurrency market seems to have cooled off, which could contribute to Ethereum's potential reversal. When the broader market experiences a slowdown, it can offer investors an opportunity to reevaluate their positions and potentially spark a resurgence in demand for assets like Ethereum.
Cardano stabilizes
Following a period of turbulence, the cryptocurrency market appears to be stabilizing, with Cardano (ADA) potentially eyeing a bounce after a significant decrease in volatility. Over the past week, ADA has been in freefall, dropping below the ascending price channel that has guided its trajectory for some time.
In the last few days, Cardano's volatility has decreased substantially, which could be a precursor to a short-term reversal. When an asset's volatility subsides, it often indicates that the market is consolidating and could be preparing for a change in direction. This reduced volatility in ADA's price movement may suggest that selling pressure is waning, and buyers could soon regain control, leading to a potential bounce.
It is important to note that Cardano has fallen below the ascending price channel, which previously acted as a support level for the asset. This break below the channel signifies a bearish signal for ADA, as it implies that the bullish trend that guided its price action has been disrupted.
 Dan Burgin