Disclaimer: The opinions expressed by our writers are their own and do not represent the views of U.Today. The financial and market information provided on U.Today is intended for informational purposes only. U.Today is not liable for any financial losses incurred while trading cryptocurrencies. Conduct your own research by contacting financial experts before making any investment decisions. We believe that all content is accurate as of the date of publication, but certain offers mentioned may no longer be available.
Bitcoin (BTC) is back in the red this week, and while there is no full-blown panic, the technical indicators are starting to show just how far things could worsen for bulls if this selling pressure continues.
One of the clearest tools for mapping this kind of scenario is not some secret indicator but the familiar Bollinger Bands, which quietly outline the upper and lower bounds of price volatility. Right now, the lower bounds are sitting lower than most realize.

On the daily time frame, Bitcoin has slipped below its 20-day average, the middle of the band, which had been providing short-term support at around $118,100. Losing this support level is not dramatic in itself, but it does tip the balance toward the lower boundary, which is currently around $116,300.
If market conditions do not improve soon, this level will be the first real test. Should things become more aggressive, the price could fall toward $112,000, which aligns with the outer limit of expected volatility.
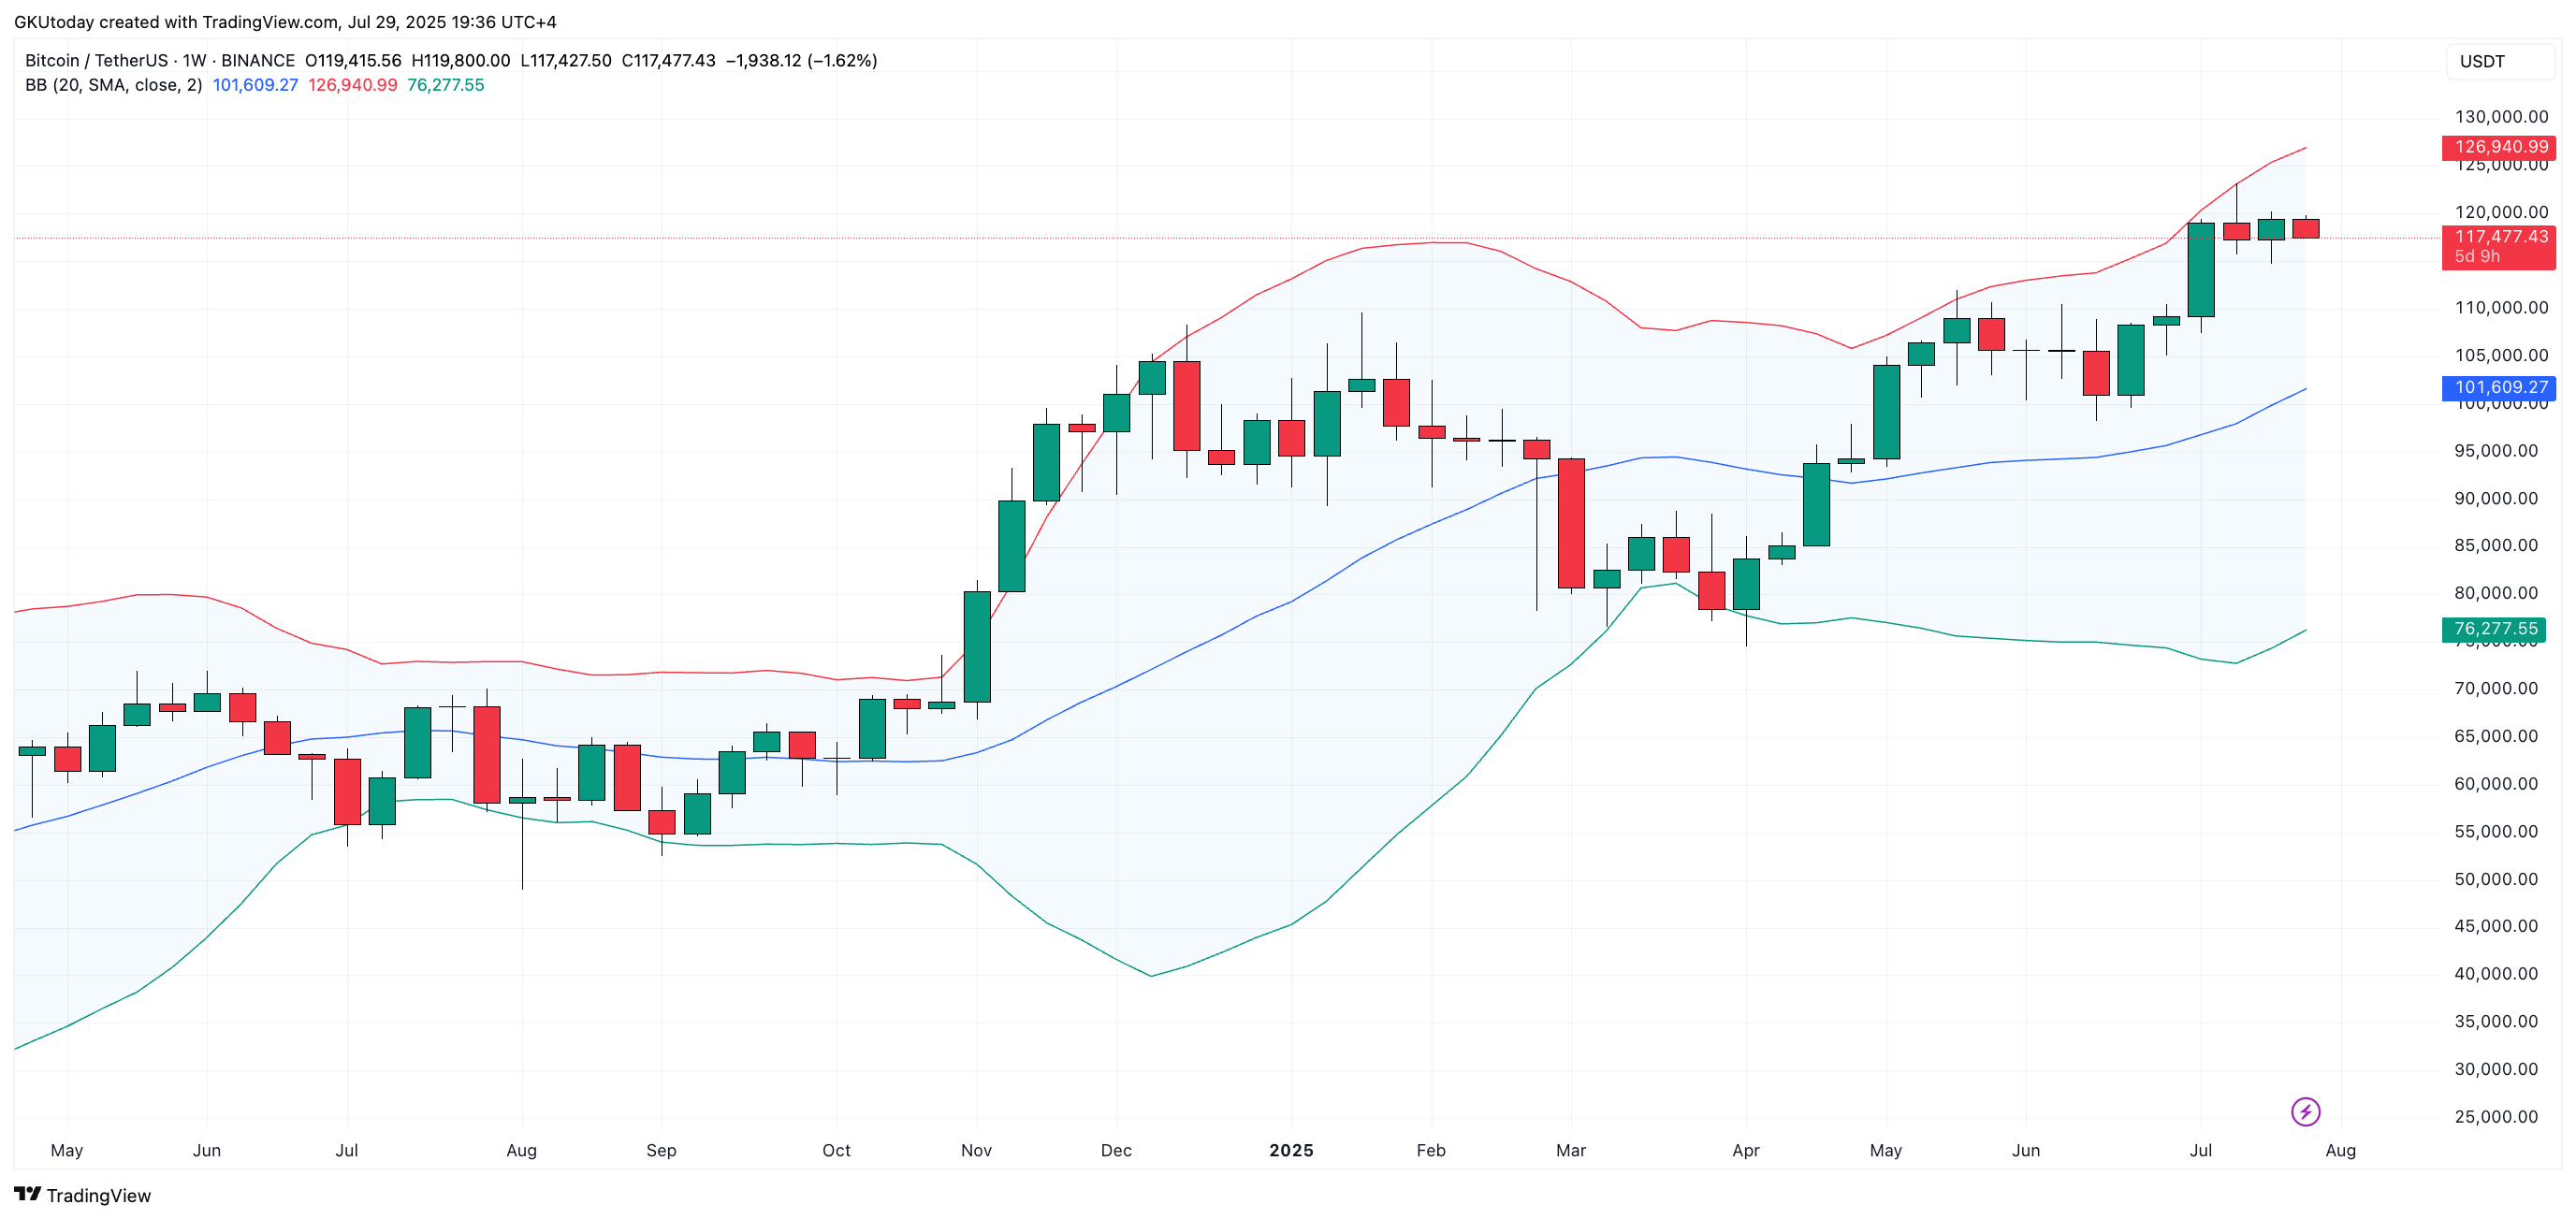
However, it is the weekly and monthly time frames that provide a broader perspective. The lower weekly band is currently at around $76,000 — not because anyone expects Bitcoin to fall that far tomorrow but because the structure allows it to go down to that level without disrupting the bigger picture.
Bitcoin to $35,000? Not surreal
On the monthly chart, the midline, which often marks the longer-term median trend, is sitting around $77,000 per BTC, while the lower Bollinger band, far below current levels, is sitting at around $35,000. This is the technical bottom of the channel should the broader market unwind dramatically.

The bands do not predict direction; they simply define the range. Right now, the lane beneath Bitcoin stretches farther than most people are anticipating.
This is not a warning but a reminder that, if support keeps cracking, the next stops are already in place, whether anyone is looking at them or not.
 Dan Burgin
 U.Today Editorial Team