The market has been carried away by a deep correction, which led to a strong correlation between the majority of assets. Each grows at its own pace, but everything falls together. The correlation will remain for some time, although BCH, ETC, XRP and some other assets are beginning to weaken these ties, getting significantly ahead of the market in the reversal.
At this time, to understand the situation in the market as a whole, it is enough for us to examine they key BTC/USD pair.
Celebration and catastrophe
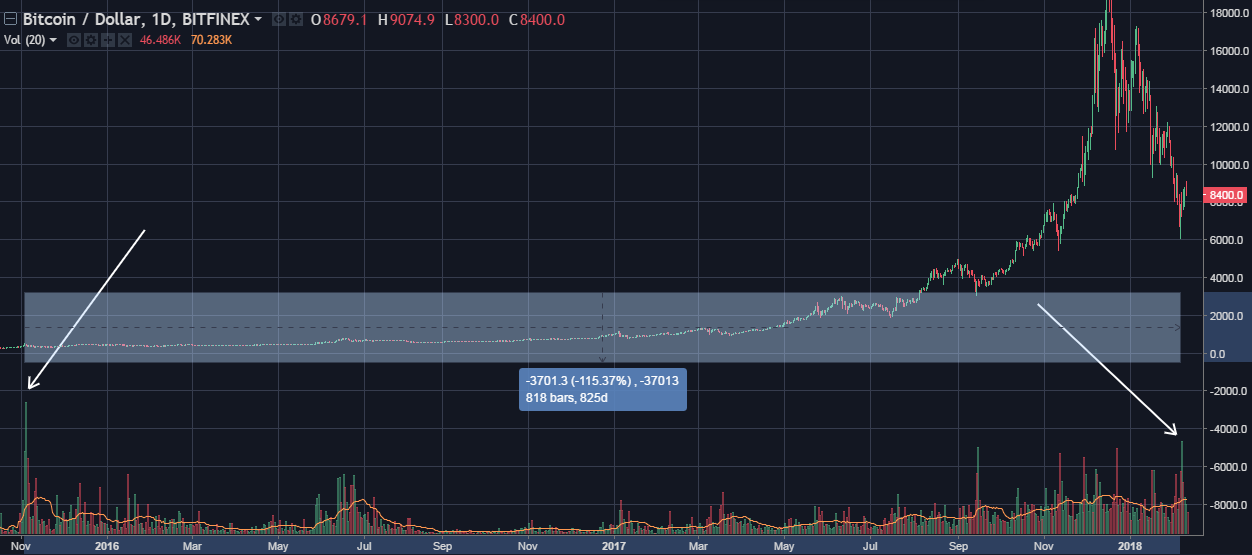
On Feb. 6, market trading volume reached an 825-day record level. Asset sales gave the impression of a celebration and a catastrophe simultaneously: while some participants were hectically emptying the contents of their portfolios directly into the market, others were happy to snatch up the assets at a low price.
All this was accompanied by an intense atmosphere of fear, uncertainty and doubt (FUD), which was replaced by positive media rhetoric after the reversal.
As a result of Tuesday’s performance, a record volume of assets were redistributed in the market, surpassing even the volume seen at the end of the last correction on Sep. 15, 2017. Then, the price dropped from $6,000 to $3,000 in 13 days. This time the correction lasted 50 days. The market is maturing and each wave is getting longer…
What does this trading volume indicate? With high probability, we can say that we have now seen the culmination of sales and a change in the direction of the trend. In other words, I believe we are reversing, from a bearish to bullish market.
It’s true that the market can continue to show weakness for some time, but do not believe the wolves! Any price reduction from the current levels is nothing but an indication of whales taking on growing positions. Remember, it will take some time for the market to thaw after a 70 percent shock freeze.
Top assets performance
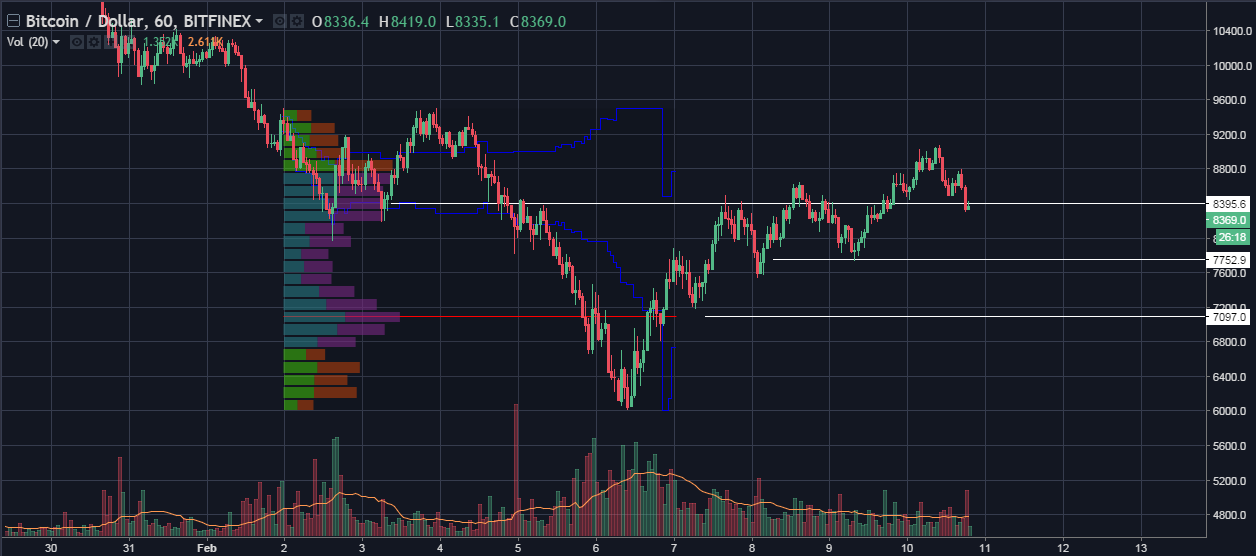
Take a look at the purchasing cards with record volumes in the top 3 assets — BTC, ETH, XRP. In general, it seems that the big players were overzealous with intimidating the crowds or began entry too early. We see that the initial purchase volumes began on Feb. 2, but reached a maximum on Feb. 6. The matador dodged the bull.
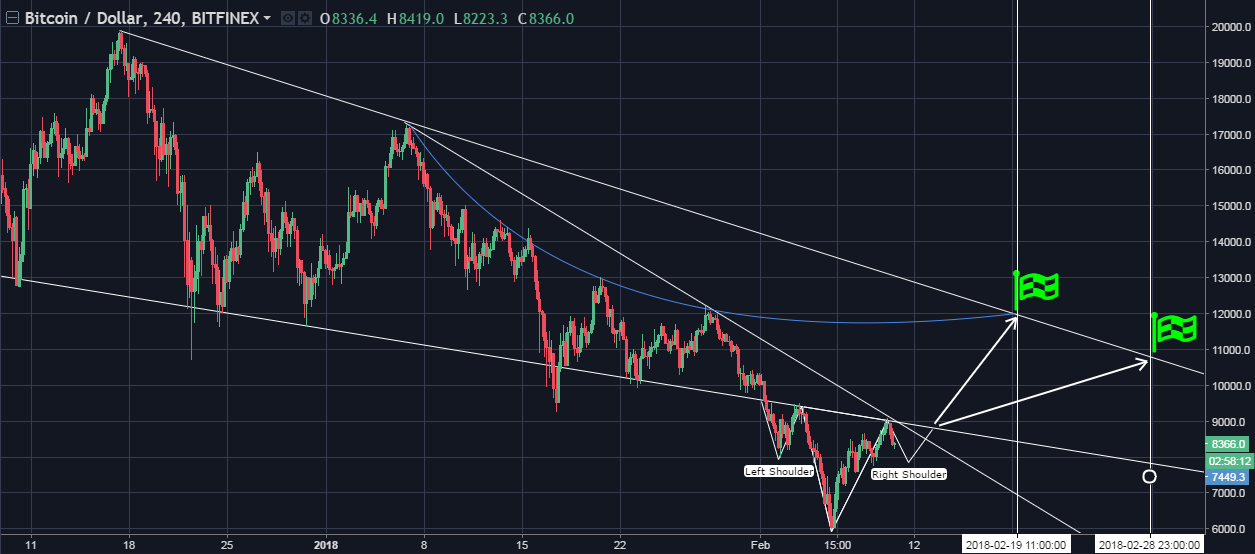
1. BTC purchase card. Here you can clearly see the purchasing interest at two levels — $8,400 and $7,100, with an average price around $7,750 and as a result, the formation of a support at this level.
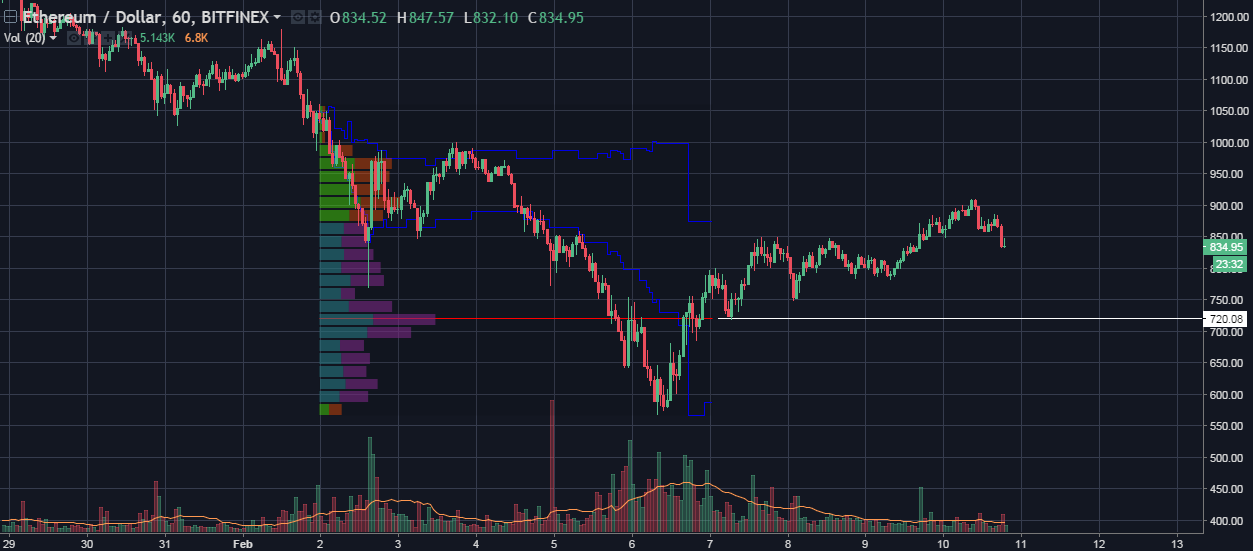
2. ETH purchase card. Here, buyer demand is clearly visible at $720, which proved to be a good support level.
3. XRP purchase card. Here, buyer demand is clearly visible at $0.69, which also proved to be a good support level.
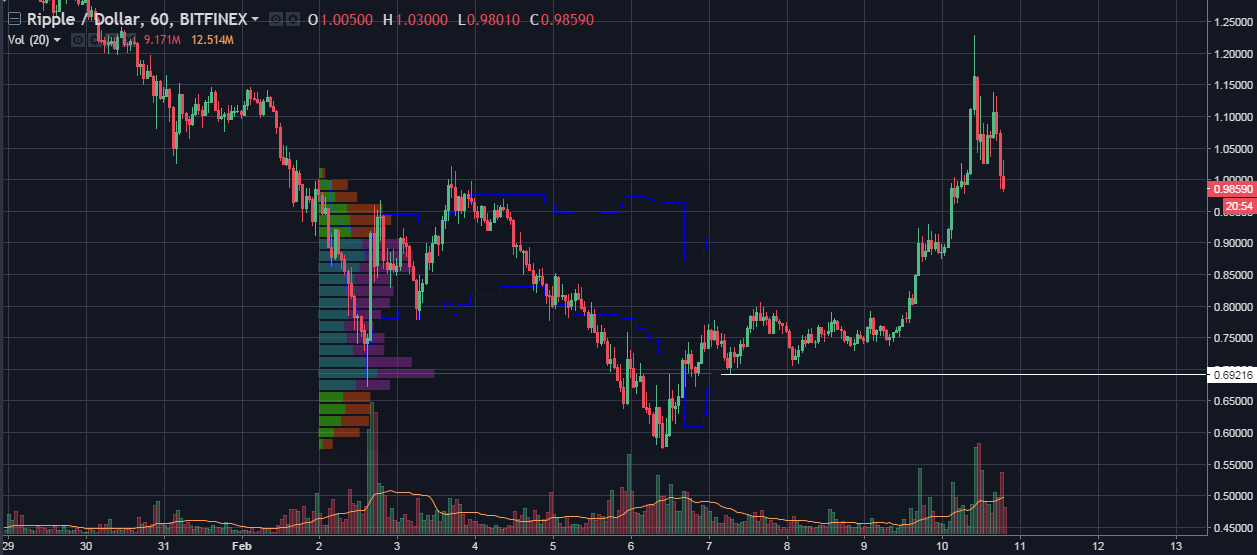
It is important to understand that major interest is localized at these levels and they will define the reversal trend.
One of the scenarios of reversal from the current level is as follows: Now we will activate the "head and shoulders" figure and move towards $12,000 by Feb. 19 or $11,000 by Feb. 28, depending on the strength of growth.
Keep in mind that this review does not take away your right to independent assessment of the market situation and is not a direct recommendation for investment activity!
Wishing you profitable transactions and peace of mind.
 Dan Burgin