Disclaimer: The opinions expressed by our writers are their own and do not represent the views of U.Today. The financial and market information provided on U.Today is intended for informational purposes only. U.Today is not liable for any financial losses incurred while trading cryptocurrencies. Conduct your own research by contacting financial experts before making any investment decisions. We believe that all content is accurate as of the date of publication, but certain offers mentioned may no longer be available.
The second part of the week has begun with bearish tendencies for the major cryptocurrencies. All of the top 10 coins are in the red zone, with the main loser Binance Coin (BNB)—whose rate declined 5.72% over the past day.
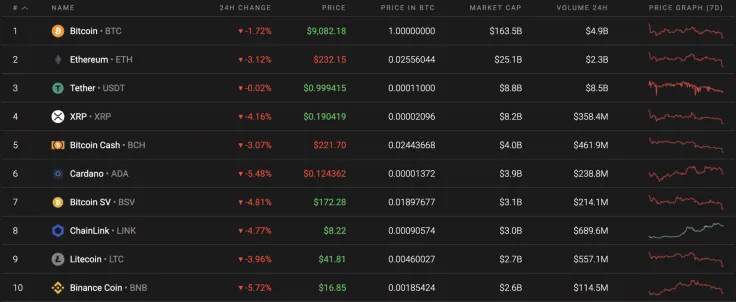
Take a look at Bitcoin (BTC), Ethereum (ETH) and XRP's data.
|
Name |
Ticker Advertisement
|
Market Cap |
Price |
Volume (24h) Advertisement
|
Change (24h) |
|
Bitcoin |
BTC |
$167 846 256 530 |
$9 105,07 |
$16 631 902 723 |
-1.75% |
|
Ethereum |
ETH |
$26 011 934 981 |
$232,70 |
$6 588 057 818 |
-3.09% |
|
XRP |
XRP |
$8 452 611 768 |
$0,190986 |
$1 155 395 334 |
-3.33% |
BTC/USD
According to the chart, Bitcoin (BTC) failed to break through the upper border of the descending triangle, which indicates the weakness of buyers. Now the price is slowly approaching the support zone of $8,900-$9,000, where buyers are likely to aggressively buy back while holding the level.
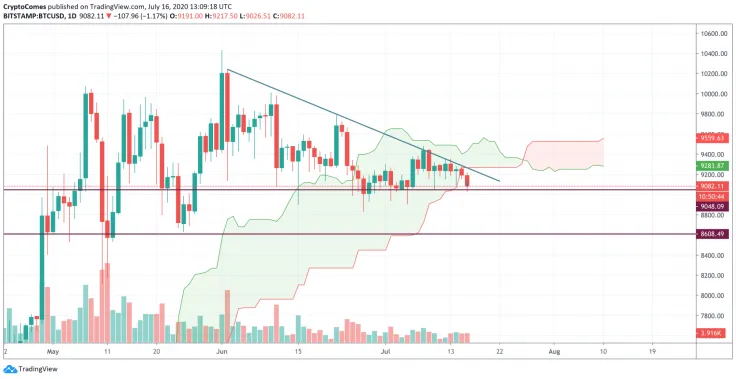
Perhaps this time the support will not resist, since a downtrend has been visible since June 1, when Bitcoin (BTC) was unable to gain a foothold below the $10,000 mark. Turning to the Ichimoku Cloud indicator, one sees that the price has already gone beyond the lower border of the "cloud." This suggests a possible fall to at least the support level of $8,600 around next week.
Bitcoin is trading at $9,082 at press time.
ETH/USD
Ethereum (ETH) made a retest of the support zone from July 6 at $230. The bearish pressure is still high, however, the altcoin might face a short correction to around $235 by the end of the week.
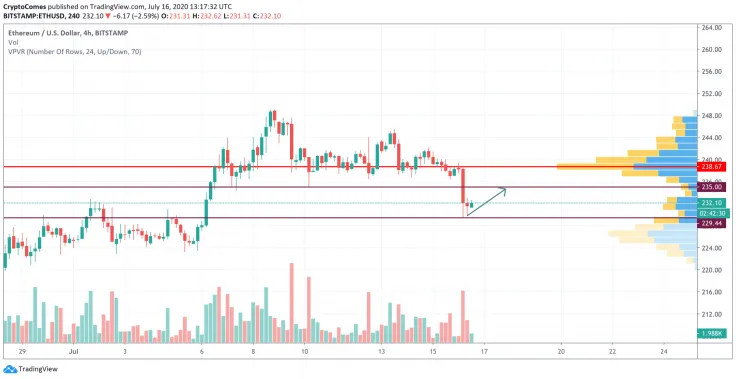
On the 4H chart, the selling trading volume is trending slightly downward, which means that sellers are running out of fuel to push the price deeper. A possibility of growth to the area around $235 is also supported by the high liquidity there. It is important to mention that this is just a correction and not the start of a bull run.
Ethereum is trading at $231.93 at press time.
XRP/USD
XRP quotes on the daily chart are pushed back from the upper border of the Bollinger Bands indicator, which indicates pressure from sellers. There was already a similar price rebound previously and a fall to the lower border of the indicator with an attempt to break it out.
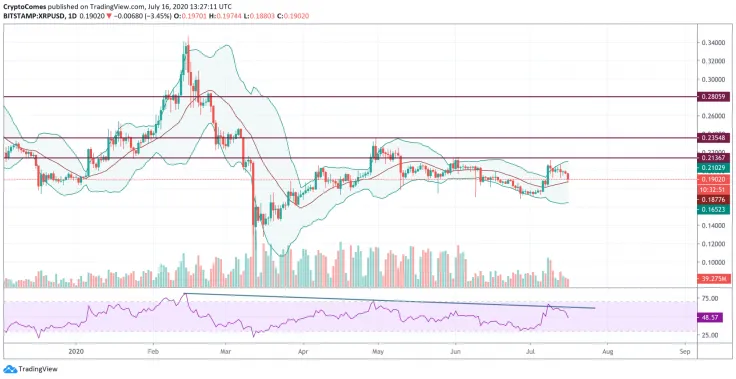
A strong signal in favor of a decline is also a rebound from the resistance line on the RSI indicator, the values of which have not even reached the level of 70. This behavior by the indicator suggests the presence of a downward impulse and the dominance of a bear market. In the event of a breakdown of the support area and price fixing below $0.1685, one can expect a decline to $0.1180.
XRP is trading at $0.1904 at press time.
 Dan Burgin
 U.Today Editorial Team